Oren Eini

CEO of RavenDB

a NoSQL Open Source Document Database

Get in touch with me:

oren@ravendb.net +972 52-548-6969

Posts: 7,527
|
Comments: 51,163
Privacy Policy · Terms
filter by tags archive
time to read 5 min | 883 words

Note, this post was written by Federico. In the previous post after inspecting the decompiled source using ILSpy  we were able to uncover potential things we could do.

By now we already squeeze almost all the obvious inefficiencies that we had uncovered through static analysis of the decompiled code, so now we will need another strategy. For that we need to analyze the behavior in runtime in the average case. We did something like that when in this post when we made an example using a 16 bytes compare with equal arrays.

To achieve that analysis live we will need to somehow know the size of the typical memory block while running the test under a line-by-line profiler run. We built a modified version of the code that stored the size of the memory chunk to compare and then we built an histogram with that (that’s why exact replicability matters). From our workload the histogram showed that there were a couple of clusters for the length of the memory to be compared. The first cluster was near 0 bytes but not exactly 0. The other cluster was centered around 12 bytes, which makes sense as the keys of the documents were around 11 bytes. This gave us a very interesting insight. Armed with that knowledge we made our first statistical based optimization.

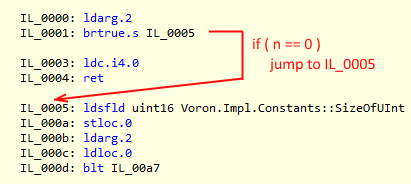
You can notice the if statement at the start of the method, which is a pretty standard bounding condition. If the memory blocks are empty, therefore they are equal. In a normal environment such check is so simple that nobody would bother, but in our case when we are measuring the runtime in the nanoseconds, 3 extra instructions and a potential branch-miss do count.

That code looks like this:

image

That means that not only I am making the check, we are also forcing a short-jump every single time it happens. But our histogram also tells us that memory blocks of 0 size almost never happen. So we are paying with 3 instructions and a branch for something that almost never happen. But we also knew that there was a cluster near the 0 that we could exploit. The problem is that we would be paying 3 cycles (1 nanosecond in our idealized processor) per branch. As our average is 97.5 nanoseconds, we have 1% improvement in almost any call (except the statistically unlikely case) if we are able to get rid of it.

Resistance is futile, that branch needs to go. Smile

In C and Assembler and almost any low level architecture like GPUs, there are 2 common approaches to optimize this kind of scenarios.

  • The ostrich method. (Hide your head in the sand and pray it just work).
  • Use a lookup table.

The first is simple, if you don’t check and the algorithm can deal with the condition in the body, zero instructions always beats more than zero instruction (this case is a corner case anyways, no damage is dealt). This one is usually used in massive parallel computing where the cost of instructions is negligible while memory access is not. But it has its uses in more traditional superscalar and branch-predicting architectures (you just don’t have so much instructions budget to burn).

The second is more involved. You need to be able to “index” somehow the input and pay with less instructions than do the actual branches (at a minimum of 1 nanosecond each aka 3 instructions of our idealized processor). Then create a branch table and jump to the appropriate index which itself will jump to the proper code block using just 2 instructions.

Note: Branch tables are very well explained at http://en.wikipedia.org/wiki/Branch_table. If you made it that far you should read it, don’t worry I will wait.

As the key take away if your algorithm have a sequence of 0..n, you are in the best world, you already have your index. Which we did Smile.

I know what you are thinking: Will the C# JIT compiler be smart enough to convert such a pattern into a branch table?

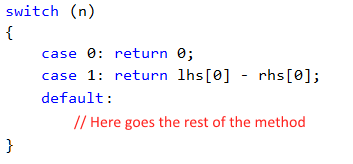
The short answer is yes, if we give it a bit of help. The if-then-elseif pattern won’t cut it, but what about switch-case?

The compiler will create a switch opcode, in short our branch table, if our values are small and contiguous.

Therefore that is what we did. The impact? Big, but this is just starting. Here is what this looks like in our code:

image

I’ll talk about the details of branch tables in C# more in the next post, but I didn’t want to leave you hanging too much.

Voron on Linux

time to read 1 min | 73 words

So, this just happened:

image

Note that this is a very important step, but it is just a first step. We have a few Linux experts review the code, and we haven’t even started yet with working on RavenDB itself.

But I’m pretty happy right now.

time to read 3 min | 502 words

Note, this post was written by Federico. In the previous post after inspecting the decompiled source using ILSpy  we were able to uncover potential things we could do. In this fragment we have a pretty optimized method to compare an entire 4 bytes per loop. What if we could do that on 8 bytes?

To achieve that we will use a ulong instead of a uint. This type of optimization makes sense for 2 reasons.

Most of our users are already running RavenDB in x64 where the native word is 8 bytes and Voron is compiled on x64 only. But even if that were not true, since the late 2000’ most CPUs would have a 64 bytes L1 cache line with half a cycle cost for a hit. So even if you can’t handle 64 bits in one go and the JIT or processor have to issue 2 instructions you are still getting a L1 cache hit and no pipeline stall. Which is GREAT Smile.

So without farther ado, this is the resulting code:

image

Ayende’s note: In the code, the lp += (IntPtr)8/8; is actually defined as lp += 1; What is actually happening is that we are increasing by 8 bytes (size of ulong), and this is how ILSpy decided to represent that for some reason.

The actual IL generated for this is good:

image

It is just that the translation here is kind of strange.

Therefore the question to ask here is: Will skipping over the parts of the memory block that is equal at a faster rate will compensate for the cost of doing a final check with 8  bytes instead of 4 bytes?

Well the answer is a resounding yes. It won’t have much impact in the first 32 bytes (around 3% or less). We won’t lose, but we won’t win much either. But after that it skyrocket.

// Bandwidth optimization kicks in
Size:       32 Original:     535 Optimized:   442 Gain:    5.01%
Size:       64 Original:     607 Optimized:   493 Gain:    7.08%
Size:    128 Original:     752 Optimized:   573 Gain:   11.77%
Size:     256 Original: 1,080 Optimized:   695 Gain:   35.69%
Size:     512 Original: 1,837 Optimized:   943 Gain:   74.40%
Size: 1,024 Original: 3,200 Optimized: 1,317 Gain: 122.25%
Size: 2,048 Original: 5,135 Optimized: 2,110 Gain: 123.13%
Size: 4,096 Original: 8,753 Optimized: 3,690 Gain: 117.29%

Those are real measurements. You can see that when bandwidth optimization kicks in the gains start to get really high. This means that changing the bandwidth size alone from 4 byte to 8 bytes got us an order of magnitude improvement stabilizing around 120%.

Not bad for 2 lines of work.

time to read 5 min | 832 words

Note, this post was written by Federico. Where I had notes or stuff to extend, I explicitly marked it as such. In the previous post after inspecting the decompiled source using ILSpy  we were able to uncover potential things we could do.

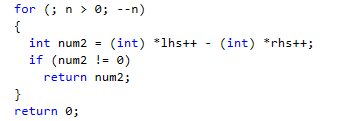
Did you remember how dotPeek and ILSpy didn’t agree on the last for-loop?

dotPeek

image

ILSpy

image

Well to really know which one is right, lets dig deeper. Looks like dotPeek is just too smart for our purposes.

image

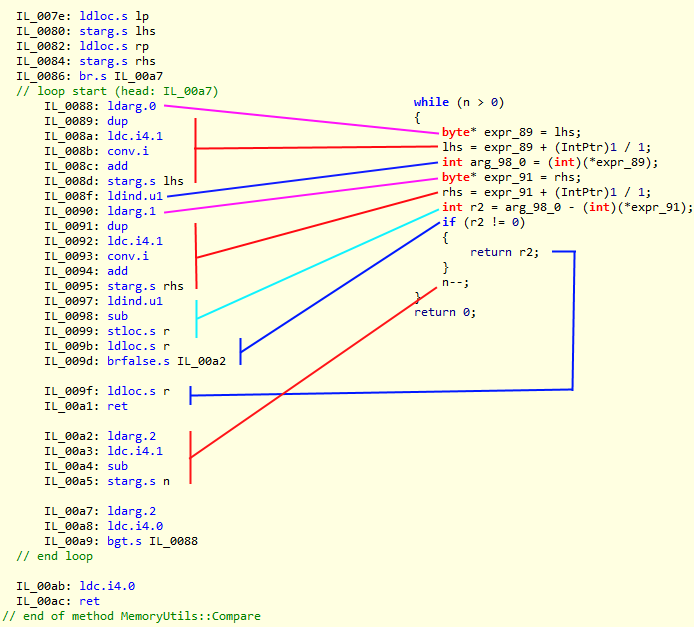
MSIL is an stack machine, so everything has to be pushed to the stack to be operated. And the lower you go the less context you have to make optimization choices. The compiler knows a lot more, therefore it can make sensible choices that the JIT can’t. Well this is one of those, the problem here is that the compiler is treating those native memory references in a very “un-native” way, leaving small room to the JIT to do its magic. Therefore we are going to give the compiler a nudge to point him in the right direction. 

We know that most architecture have a set of indexed instructions that will allow you to load from memory at a base address plus an offset and special ones optimized to operate with constants. Yeah all that magic in a single opcode.

Therefore if we can find a way that the compiler would emit such  a sequence, there is a high chance that the JIT will understand it and emit such a load statement. What could appear to be a long shot is actually quite easy. Instead of doing pointer arithmetic (pre/post increment and dereferencing) as usual, we will do something we would never do in C/C++; we will just ask for it at face value.

So what would be:

var v = *(lhs++) – *(rhs++); 

Now becomes:

var v = lhs[0] - rhs[0]; 

lhs++; 

rhs++;

What if we need the next one?

var v = lhs[1] - rhs[1]; 

And so on… However, that is true if and only if the number can be loaded into the stack using an special short instruction (a shortcut) that encodes the value to load as a named constant.

Why this work?

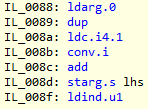
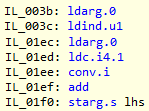
Because the MSIL pattern is unequivocal:

image

We push the first pointer (lhs) 

We load a byte from it and put it into an int32 register in the stack 

We push the second pointer (rhs) 

We load a byte from it and put it into an int32 register in the stack 

We subtract the two loaded int32. 

We store it into an stack variable (v) 

We load it into the stack from (v) 

We check if it is distinct from (0) 

The JIT now can figure out how to optimize this with a load + offset instruction easily. Moreover the offset is also a constant, anyone said “special opcode”?. Now let’s compare the IL code  from each approach.

Before Optimization:

image

After Optimization

image

While the amount of instructions is the same and the avid reader would have figured out by now; the code is not that different either.

However, the former translate to far more native instructions than the latter. Why? We will have to ask the JIT or the compiler guys, but my hypothesis is that the first version requires a much more deeper analysis than the second and in an effort to keep the JIT overhead low, that pattern can’t be optimized so much.

The bottom line is: “Do not optimize pointers in C# as you do in C/C++. Translating an optimized algorithm that uses pointers from C/C++ to C# will not be optimal.”

Remember this, it will make sense soon, because in the next post, we’ll tie it all together.

time to read 2 min | 377 words

Note, this post was written by Federico. Where I had notes or stuff to extend, I explicitly marked it as such. In the previous post after inspecting the decompiled source using ILSpy  we were able to uncover potential things we could do.

Getting rid of unwanted type conversion may seem as an small cost, but let’s make an example. Let’s say we are comparing 2 memory arrays of 16 bytes and they are equal (our worst case scenario).

Just for the sake of simplification from the 3 potential causes the memory is aligned so there is no need to the first 2 unwanted conversions. That leaves us with the main body as the only source of unwanted conversions.

image

Now this loops moves our pointer 4 bytes each time and causes 2 conversions. Therefore for a 16 bytes array (a pretty average size) we are performing 8 conversions, that is grand total of 8 conversions. Assuming our idealized processor, at 0.33 ns per conversion instruction we have 2.64 ns or roughly 3% of the total time per average call. Getting rid of that is easy, as the size of an unsigned int is a constant.

private const int sizeOfUint = sizeof(uint);

Therefore the final executable code will be:

image

Here we have 2 interesting side effects:

  • We no longer have the conversion but also the constant got put instead of the indirection to an stack variable.
  • Almost every comparison you do over a constant that is 2^n based can be converted to a shift operation.

If the JIT is smart enough, this check can be compiled into a shift of 2 places and asking if the result is bigger than 0. Squeezing 4 instructions into 2 per each while cycle.

You guessed right, the JIT is. Smile

time to read 6 min | 1029 words

Note, this post was written by Federico. Where I had notes or stuff to extend, I explicitly marked it as such.

TLDR: Optimizing at this level is really hard. To achieve gains of 20%+ for Compare and from 200% to 6% in Copy (depending on the workload) we will need to dig very deep at the IL level.

Another area we looked deeply into is, how do we move and access the memory. This type of optimization work is especially relevant if you are using Voron to handle big workloads. With small databases the improvements can be felt, but where they shine is when dealing with multi-gigabyte databases or high-throughput key-value retrieves and put workloads (did anyone thought Bulk-Inserts?).

Using FreeDB as in this previous post we build an experiment which we could use to pinpoint the pain points making sure we could also repro it every single time (no indexes, no extra call around). Under the microscope 2 pain points were evident when dealing with memory. Comparing and moving memory around.

We usually compare memory straight from the mmaped unmanaged memory when looking for a particular document in Voron Trees; and to copy from and to Voron pages when storing and retrieving documents. These are very core operations for any storage engine, Voron is not an special case. Before we started the optimization effort we already had a pretty optimized routine.

What this method does is:

  • If the memory blocks have zero size, there is no doubt they are equal.
  • If the memory blocks are bigger than the size of a word (32 bits) we do a pre-compare over the aligned memory blocks (for performance) in order to rule out all the equals.
  • As we cannot use words to calculate the output (handling the Endianness would cost us), we do a byte by byte comparison for the final check.                   

For our insert workload we were roughly in the 97.5 nanoseconds per memory compare in average. To put in context, if each assembler instruction could be executed in exactly 1 cycle (which usually is not true) then 3 instruction is an entire nanosecond, therefore our average instruction budget is 291 instructions. Remember this idealized processor, we will use this same comparison later for more complex analysis.

Memory compares can be of different sizes that is why controlling the environment is very important for this type of optimization work.

To deal with that and we were using many tricks from the optimization book. From ensuring that memory alignment is optimal to batch compares with bigger primitive sizes to pointer arithmetic. At first sight this one is the kind of method you won't optimize at all, it is pretty damn tight.

Ayende’s node – We have already done a optimization step on memory comparisons. We initially just shelled out to the native memcmp method, but the cost of doing a pinvoke call ended up being noticable, and we wrote the previously optimized version (and had several rounds of that) to alleviate that cost.

However, we took to the challenge because the payoff can be huge. For a very small bulk insert of 50,000 documents inserted in an empty database, we are talking about in the ballpark of 5 million compares (yeah you read it right). Even if we manage to squeeze 1% off, the sheer volume of calls will make it worthwhile. To achieve that we had to do the unthinkable, we had to resort to dig into the MSIL that method was generating. Armed with ILSpy we found out we may have a way to shave off some inefficiencies.

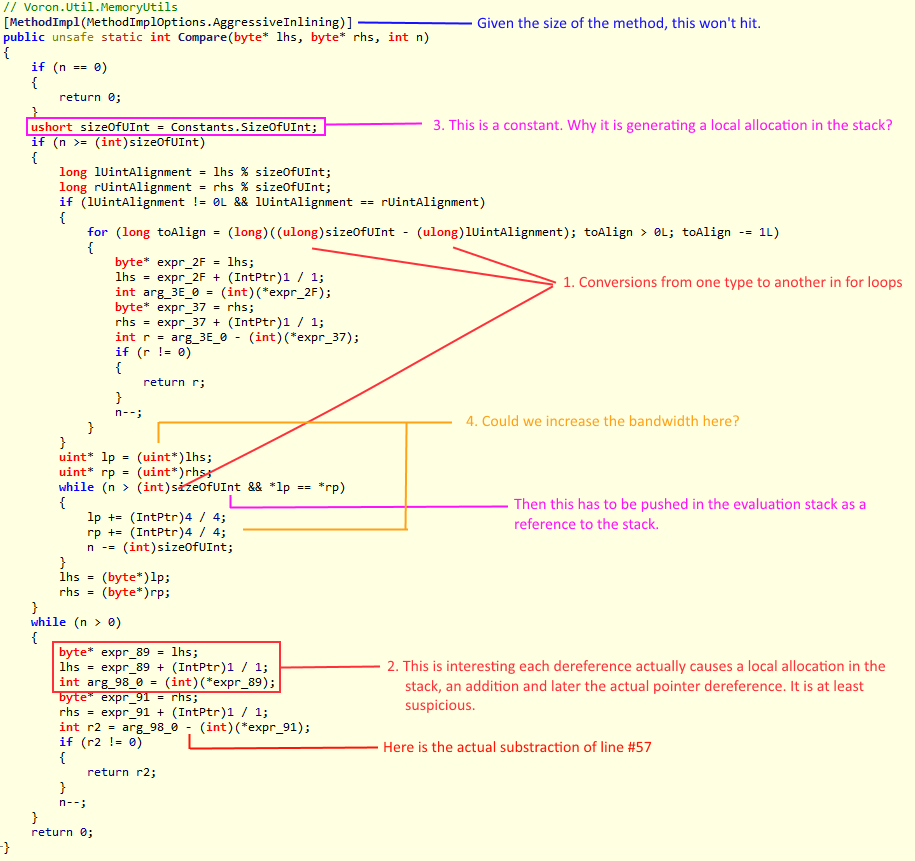
Here is the what this look like when we start actually putting analysis to action. You can see the method code (after decompilation, so we can be closer to the IL) as well as the issues that were discovered in the process.

image

Because of the size of the method the fastest way was to resort to use a C# decompile, even though we then matched it with the generated IL. The trick to use the C# decompiled version requires that we use a decompiler that is not too smart when dealing with the code. If the decompiler would have understood what was the original code intention and acted upon it, we would have never spotted some of the optimizations at this level. For example, the last loop decompiled with JetBrains dotPeek would look like this:

image

Always keep around an old version of a decompiler just in case you may need it Smile.

Ayende’s note: In most cases, you can select the level of details that a decompiler can give you. With Reflector, for example, you can select how deeply it will decompile things, but even so, doing stupid decompilation can be very beneficial by showing us what is actually going on.

Understanding where the inefficiencies may be, is one thing, being able to prove them is another matter. And we will tackle all of them in future posts.

We will also leave the memcpy analysis for later because it builds on the optimizations used in memcmp and also requires a deep analysis of the Buffer.Memcpy method already available in the .Net Framework (for internal use of course).

If what we did to the poor Etags was evil. You are now arriving at the gates of the underworld.

Ayende’s note: This is a pretty complex topic, and it goes on for quite a while. In order to maintain interest, and to avoid having people getting lost in the details, I broke it apart for several posts. In the meantime, given the details in this post, how would you suggest improving this?

time to read 3 min | 410 words

This ended up being a pretty obvious, in retrospect. We noticed in the profiler that we spent a lot of time working with headers. Now, RavenDB is using REST as the communication layer, so it is doing a lot with that, but we should be able to do better.

Then Tal dug into the actual implementation and found:

public string GetHeader(string key)
{
	if (InnerHeaders.Contains(key) == false)
		return null;
	return InnerHeaders.GetValues(key).FirstOrDefault();
}

public List<string> GetHeaders(string key)
{
	if (InnerHeaders.Contains(key) == false)
		return null;
	return InnerHeaders.GetValues(key).ToList();
}


public HttpHeaders InnerHeaders
{
	get
	{
		var headers = new Headers();
		foreach (var header in InnerRequest.Headers)
		{
			if (header.Value.Count() == 1)
				headers.Add(header.Key, header.Value.First());
			else
				headers.Add(header.Key, header.Value.ToList());
		}

		if (InnerRequest.Content == null)
			return headers;

		foreach (var header in InnerRequest.Content.Headers)
		{
			if (header.Value.Count() == 1)
				headers.Add(header.Key, header.Value.First());
			else
				headers.Add(header.Key, header.Value.ToList());
		}

		return headers;
	}
}

To be fair, this implementation was created very early on, and no one ever actually spent any time looking it since (why would they? it worked, and quite well). The problem is the number of copies that we have, and the fact that to pull a since header, we have to copy all the headers, sometimes multiple times. We replaced this with code that wasn’t doing stupid stuff, and we couldn’t even find the cost of working with headers in the profiler any longer.

But that brings up a really interesting question. How could we not know about this sort of thing? I mean, this isn’t the first time that we are doing a performance pass on the system. So how come we missed this?

The answer is that in this performance pass, we are doing something different. Usually we perf-test RavenDB as you would when using it on your own systems. But for the purpose of this suite of tests, and in order to find more stuff that we can optimize, we are actually working with a stripped down client, no caching, no attempt to optimize things across the entire board. In fact, we have put RavenDB in the worst possible situation, all new work, and no chance to do any sort of optimizations, then we start seeing how all of those code paths that were rarely hit started to light up quite nicely.

time to read 2 min | 348 words

This nugget was discovered by Tal, who was measuring write throughput and noticed that a lot of the time wasn’t being handled in the proper code path, but on something on the side that seemed… off.

prefetchingQueue.Aggregate(0, (x,c) => x + SelectSerializedSizeOnDiskIfNotNull(c)) > context.Configuration.AvailableMemoryForRaisingBatchSizeLimit)

This piece of code is responsible for heuristics deep inside the bowels of RavenDB. In fact, it is the piece that decide whatever we have enough memory to index directly from memory or do we need to start dumping stuff and pay the I/O cost of them later.

As a result, this piece of code is called once for every document save. It was also quite wildly inefficient. The Aggregate implementation was pretty much as you imagined it, and it took three times as much time as actually process the rest of the request. The underlying reason was that we kept doing a foreach and a delegate invocation on each an every call. The more documents we had coming in, the more work we had to do. Shlemiel the painter at his best.

We first saw a major improvement by just removing the Aggregate() call in favor of a purpose built function that summed all those details for us directly. Next, we changed things so instead of doing O(N) work per request, we could do an O(1) work by doing this work one bit at a time and aggregating it on the fly. So whenever we added or removed something to the prefetching queue, we would also make sure to add / remove that from the global tally.

Once that is done, we saw almost 18% improvement in high write scenarios, because we weren’t just busy counting how much stuff we have in memory to figure out if we can put things in memory.

I can’t emphasize enough how important it is that the work throughout was done using a profiler (in our case, the excellent dotTrace) because if dotTrace wouldn’t have point a big finger at this line of code, we would have never have considered this to be problematic.

time to read 7 min | 1302 words

RavenDB uses a lot of dates, from the last modified metadata on a document to the timestamp of an index or when a query was started or… you get the point, lots and lots of dates.

Dates in RavenDB are usually formatted in the following manner:

2015-01-15T00:41:16.6616631

This is done using the following date time format:

yyyy'-'MM'-'dd'T'HH':'mm':'ss.fffffff

This is pretty awesome. It generate readable dates that are lexicographically sorted. There is just one problem with that, this is really expensive to do. How expensive? Well, outputting 10 million dates using the following manner:

dateTime.ToString(Default.DateTimeFormatsToWrite, CultureInfo.InvariantCulture)

This takes 13.3 seconds, or just about 750 dates per millisecond. The costs here are partly the allocations, but mostly it is about the fact that the format provider needs to first parse the format specifier, then do quite a bit of work to get it working. And DateTime itself isn’t very cheap. The solution presented is ugly, but it works, and it is fast.

public unsafe static string GetDefaultRavenFormat(this DateTime dt, bool isUtc = false)
{
    string result = new string('Z', 27 + (isUtc ? 1 : 0));

    var ticks = dt.Ticks;

    // n = number of days since 1/1/0001
    int n = (int)(ticks / TicksPerDay);
    // y400 = number of whole 400-year periods since 1/1/0001
    int y400 = n / DaysPer400Years;
    // n = day number within 400-year period
    n -= y400 * DaysPer400Years;
    // y100 = number of whole 100-year periods within 400-year period
    int y100 = n / DaysPer100Years;
    // Last 100-year period has an extra day, so decrement result if 4
    if (y100 == 4) y100 = 3;
    // n = day number within 100-year period
    n -= y100 * DaysPer100Years;
    // y4 = number of whole 4-year periods within 100-year period
    int y4 = n / DaysPer4Years;
    // n = day number within 4-year period
    n -= y4 * DaysPer4Years;
    // y1 = number of whole years within 4-year period
    int y1 = n / DaysPerYear;
    // Last year has an extra day, so decrement result if 4
    if (y1 == 4) y1 = 3;
    // If year was requested, compute and return it
    var year = y400 * 400 + y100 * 100 + y4 * 4 + y1 + 1;

    // n = day number within year
    n -= y1 * DaysPerYear;
    // Leap year calculation looks different from IsLeapYear since y1, y4,
    // and y100 are relative to year 1, not year 0
    bool leapYear = y1 == 3 && (y4 != 24 || y100 == 3);
    int[] days = leapYear ? DaysToMonth366 : DaysToMonth365;
    // All months have less than 32 days, so n >> 5 is a good conservative
    // estimate for the month
    int month = n >> 5 + 1;
    // m = 1-based month number
    while (n >= days[month]) month++;
    // If month was requested, return it

    // Return 1-based day-of-month
    var day = n - days[month - 1] + 1;

    fixed (char* chars = result)
    {
        var v = _fourDigits[year];
        chars[0] = v[0];
        chars[1] = v[1];
        chars[2] = v[2];
        chars[3] = v[3];
        chars[4] = '-';
        v = _fourDigits[month];
        chars[5] = v[2];
        chars[5 + 1] = v[3];
        chars[7] = '-';
        v = _fourDigits[day];
        chars[8] = v[2];
        chars[8 + 1] = v[3];
        chars[10] = 'T';
        v = _fourDigits[(ticks / TicksPerHour) % 24];
        chars[11] = v[2];
        chars[11 + 1] = v[3];
        chars[13] = ':';
        v = _fourDigits[(ticks / TicksPerMinute) % 60];
        chars[14] = v[2];
        chars[14 + 1] = v[3];
        chars[16] = ':';
        v = _fourDigits[(ticks / TicksPerSecond) % 60];
        chars[17] = v[2];
        chars[17 + 1] = v[3];
        chars[19] = '.';

        long fraction = (ticks % 10000000);
        v = _fourDigits[fraction / 10000];
        chars[20] = v[1];
        chars[21] = v[2];
        chars[22] = v[3];

        fraction = fraction % 10000;

        v = _fourDigits[fraction];
        chars[23] = v[0];
        chars[24] = v[1];
        chars[25] = v[2];
        chars[26] = v[3];
    }

    return result;
}

We use the same general pattern that we used with etags as well, although here we are also doing a lot of work to figure out the right parts of the date. Note that we don’t have any allocations, and we again use the notion of a lookup table to all the pre-computed 4 digits number. That allows us to process 10,000,000 dates in just over 2 seconds (2,061 ms, to be exact). Or roughly 4,850 dates per millisecond. In other words, we are about 15% of the speed of the original implementation.

This code is ugly, in fact, the last few posts has contained pretty much ugly code, that is hard to understand. But it is significantly faster than the alternative, and what is even more important, those pieces of code are actually being used in RavenDB’s hot path. In other words, that means that we have actually seen significant performance improvement when introducing them to the codebase.

time to read 6 min | 1040 words

In my previous post, I talked about how we improved the performance of Etag parsing from 5 etags/ms to 3,500 etags/ms. In this post, I want to talk about the exact opposite problem, how we take an Etag and turn it into a string. Here is the original code that we had:

public unsafe override string ToString()
{
    var sb = new StringBuilder(36);
    var buffer = stackalloc byte[8];

    *((long*)buffer) = restarts;

    sb.Append(GenericUtil.ByteToHexAsStringLookup[buffer[7]]);
    sb.Append(GenericUtil.ByteToHexAsStringLookup[buffer[6]]);
    sb.Append(GenericUtil.ByteToHexAsStringLookup[buffer[5]]);
    sb.Append(GenericUtil.ByteToHexAsStringLookup[buffer[4]]);
    sb.Append('-');
    sb.Append(GenericUtil.ByteToHexAsStringLookup[buffer[3]]);
    sb.Append(GenericUtil.ByteToHexAsStringLookup[buffer[2]]);
    sb.Append('-');
    sb.Append(GenericUtil.ByteToHexAsStringLookup[buffer[1]]);
    sb.Append(GenericUtil.ByteToHexAsStringLookup[buffer[0]]);
    sb.Append('-');

    *((long*)buffer) = changes;

    sb.Append(GenericUtil.ByteToHexAsStringLookup[buffer[7]]);
    sb.Append(GenericUtil.ByteToHexAsStringLookup[buffer[6]]);
    sb.Append('-');
    sb.Append(GenericUtil.ByteToHexAsStringLookup[buffer[5]]);
    sb.Append(GenericUtil.ByteToHexAsStringLookup[buffer[4]]);
    sb.Append(GenericUtil.ByteToHexAsStringLookup[buffer[3]]);
    sb.Append(GenericUtil.ByteToHexAsStringLookup[buffer[2]]);
    sb.Append(GenericUtil.ByteToHexAsStringLookup[buffer[1]]);
    sb.Append(GenericUtil.ByteToHexAsStringLookup[buffer[0]]);

    var etagAsString = sb.ToString();
    Debug.Assert(etagAsString.Length == 36); //prevent stupid bugs if something is refactored

    return etagAsString;
}

As you can see, we already optimized this a bit. It is using a string builder, it is using a lookup table to avoid costly byte to string. Note also that we use a stackalloc value, so there isn’t an actual allocation, but we are able to copy the values once, and then just directly access it. Which is cheaper than trying to do a lot of bit shifting.

So far so good. Running on 10 million Etags, this completes in 8.9 seconds. That is good, this gives us 1,125 Etags per milliseconds.

Here is the optimized version:

public unsafe override string ToString()
{
    var results = new string('-', 36);

    fixed (char* buf = results)
    {
        var buffer = stackalloc byte[8];
        *((long*)buffer) = restarts;
        var duget = GenericUtil.ByteToHexAsStringLookup[buffer[7]];
        buf[0] = duget[0];
        buf[1] = duget[1];
        duget = GenericUtil.ByteToHexAsStringLookup[buffer[6]];
        buf[2] = duget[0];
        buf[3] = duget[1];
        duget = GenericUtil.ByteToHexAsStringLookup[buffer[5]];
        buf[4] = duget[0];
        buf[5] = duget[1];
        duget = GenericUtil.ByteToHexAsStringLookup[buffer[4]];
        buf[6] = duget[0];
        buf[7] = duget[1];
        //buf[8] = '-';
        duget = GenericUtil.ByteToHexAsStringLookup[buffer[3]];
        buf[9] = duget[0];
        buf[10] = duget[1];
        duget = GenericUtil.ByteToHexAsStringLookup[buffer[2]];
        buf[11] = duget[0];
        buf[12] = duget[1];
        //buf[13] = '-';
        duget = GenericUtil.ByteToHexAsStringLookup[buffer[1]];
        buf[14] = duget[0];
        buf[15] = duget[1];
        duget = GenericUtil.ByteToHexAsStringLookup[buffer[0]];
        buf[16] = duget[0];
        buf[17] = duget[1];
        //buf[18] = '-';

        *((long*)buffer) = changes;

        duget = GenericUtil.ByteToHexAsStringLookup[buffer[7]];
        buf[19] = duget[0];
        buf[20] = duget[1];
        duget = GenericUtil.ByteToHexAsStringLookup[buffer[6]];
        buf[21] = duget[0];
        buf[22] = duget[1];
        //buf[23] = '-';
        duget = GenericUtil.ByteToHexAsStringLookup[buffer[5]];
        buf[24] = duget[0];
        buf[25] = duget[1];
        duget = GenericUtil.ByteToHexAsStringLookup[buffer[4]];
        buf[26] = duget[0];
        buf[27] = duget[1];
        duget = GenericUtil.ByteToHexAsStringLookup[buffer[3]];
        buf[28] = duget[0];
        buf[29] = duget[1];
        duget = GenericUtil.ByteToHexAsStringLookup[buffer[2]];
        buf[30] = duget[0];
        buf[31] = duget[1];
        duget = GenericUtil.ByteToHexAsStringLookup[buffer[1]];
        buf[32] = duget[0];
        buf[33] = duget[1];
        duget = GenericUtil.ByteToHexAsStringLookup[buffer[0]];
        buf[34] = duget[0];
        buf[35] = duget[1];

        return results;
    }
}

Note that here we don’t bother with a string builder, we directly manipulate the string. And we still use all the other tricks (the lookup table, the no allocation, the works). This code managed to get to 5.5 seconds for 10,000,000 etags, or roughly 1,800 etags per millisecond. Roughly 37.5% improvement to a pretty important piece of code.

Do you see anything else that we can do to reduce the cost even further?

FUTURE POSTS

No future posts left, oh my!

RECENT SERIES

  1. RavenDB Cloud (2):
    26 Nov 2024 - Auto scaling
  2. Challenge (75):
    01 Jul 2024 - Efficient snapshotable state
  3. Recording (14):
    19 Jun 2024 - Building a Database Engine in C# & .NET
  4. re (33):
    28 May 2024 - Secure Drop protocol
  5. Meta Blog (2):
    23 Jan 2024 - I'm a JS Developer now
View all series

Syndication

Main feed Feed Stats
Comments feed   Comments Feed Stats
}