Oren Eini

CEO of RavenDB

a NoSQL Open Source Document Database

Get in touch with me:

oren@ravendb.net +972 52-548-6969

Posts: 7,520
|
Comments: 51,141
Privacy Policy · Terms
filter by tags archive
time to read 9 min | 1721 words

image5 years ago, we introduced bulk insert support to RavenDB. The idea was to let users to have a good way to insert data into RavenDB as fast as possible. In order to do that, we created special code paths that were super optimized for loading large amount of data into the database as fast as possible.

Basically, we bypassed a lot of the stuff along the way, put some constraint on the user when calling this and smoothed everything we could. Internally, this was implemented using a pretty complex system which split work among multiple threads to handle serializing, sending over the network, parsing and writing to disk.

When we start working on 4.0, one of the very first things we did was to build bulk insert from scratch. We built it on top of TCP, instead of HTTP, and we decided that for the sake of performance, we can throw pretty much anything at this problem. The overall design looked something like this:

  • One thread at the client side, getting entities and serializing them to our blittable binary format.
  • One thread at the client side for sending the data over the network.

In order to save memory, those two threads have a common buffer pool that they reuse all the time.

  • On the server side, we have a dedicated thread reading from the network, constructing our blittable instances and validating their format and putting them in a queue.
  • On the server side, we have a dedicated thread pooling from the queue and batching requests, then saving them in a single transaction.

Like the client, we are saving memory by having a common shared buffer pool.

Initially, having a dedicated code path for bulk insert was awesome, because we could get really high performance from it. But it also introduced problems. Consider the scenario above, the server thread reading from the network is reading as fast as it can, and send the data to the queue. If the consuming thread isn’t fast enough (for example, we just hit an I/O bump), we might start accumulating stuff in the queue, and if this goes for long enough, we might run out of usable memory.

We had to implement our own backpressure and congestion control because of that, and that led to more interesting issues. Because we were starting to read very quickly, and only run into the I/O problem later, we had incidents in which we weren’t fast enough with the “let me catch my breath” notification and overloaded the TCP connection, resulting in timeouts on the client. This sounds all very complicated, and it was, but we managed to solve all of those issues and this piece of code had very few changes for a long time.

And this week we deleted all of it in favor of a radically different implementation. Basically, the new implementation will just open a standard HTTP request and write JSON strings to the network. This is about as simple an implementation as we can get. And we delete all this high performance, extremely tuned and carefully crafted code.

Why?

You might have noticed that we are putting a major emphasis on performance, so why would we throw all that code away?

There are several reasons:

  • Back pressure, congestions control and other fun factors are not things that we want to deal with, instead, we want to deal with them at the network layer, where there is a lot more information about it.
  • Complex code is costly, and it requires us to modify other pieces of code to ensure that this still works.
  • We used to getting impressive numbers from this special casing, but we are seeing similar numbers without all the hoopla.

The trigger for this was a set of optimization we did for optimizing standard write patterns. Your usual OLTP workload, basically. As we made that faster & faster, we started to think whatever it made sense to allow the bulk insert code to still remain a special snowflake. For example, the bulk insert code didn’t use our transaction merging capabilities, instead, it would directly talk to the storage. But that meant that it lost out on a lot of the benefits we made to the transaction merging code. It would also cause bulk inserts to fight concurrent write loads (including other bulk inserts), instead of cooperating.

The decision to go with TCP connection directly was made because we wanted absolute performance & control, but we have taken too much upon ourselves, and we were concerned about firewall issues. Forcing admins to open another port can be tricky, and we want to reduce the cost of deploying RavenDB instances as much as possible.

Finally, we needed something that was a lot more approachable. While using our own binary format over the wire meant that we could do a lot less work, it also put a major stumbling block if you wanted to do bulk insert via anything but our .NET code. If we wanted to do bulk insert from node.js, that would require… non trivial amount of effort, to say the least.

The new wire format looks like this:

This is trivial to integrate with regardless of platform. The reason we use this particular format? This is actually identical to the format we use for SaveChanges, and that piece of code has been through multiple optimization rounds. Here is a small example from that code path:

This is pretty fast (and gnarly) code, so we get to reuse that and benefit from any future optimizations.

The major difference here is that this is a a streaming format, that is, we are going to read from the stream and process this immediately. With SaveChanges, we have to read the whole thing to memory, and apply it as a single transaction. In the case of our new bulk insert code, we’re not going to do the whole thing as a single transaction, but a series of them, based on the actual workload.

The fun thing here is that we can dramatically reduce the overall complexity while maintaining a lot of the desired behavior. In fact, the entire bulk insert implementation is under 50 lines of code now. Small enough that I can just include it in this post in its entirety.

Note that this code rely on a lot of other code, but none of this other code is Bulk Insert specific. There are a few interesting bits here that are worth exploring.

BatchRequestParser.ReadMany allow us to stream read the data, it read each individual command and return it. The code in line 17 ( var task = await parser.MoveNext() ) is pretty strange. MoveNext is returning a Task<Task>. The idea is that we are going to read a command from the network and parse it immediately. However, if there isn’t a full command already buffered, we’ll return an async task for completing it. (The Task<Task> is here because we might need to wait for the initial command, or for the final ] of the array. We’ll probably optimize that once we are done with all the taxes on this feature, to avoid the Task allocation.).

The basic idea is that we’ll read & parse from the network as long as there is information available, and when we start waiting for the network, we’ll go into the if statement and send it to the transaction merger. That gives us three very important properties.

  • We parallelize the work, while we are waiting for the next document to arrive over the network, we are concurrently writing the current batch to disk. Note that we don’t have any such things as batch size defined. This is all controlled by the network speed. We do have the 16 MB limitation, to prevent a really fast network from causing excess memory utilization on the server side.
  • We are only buffering a relatively small amount of data (by default, however much the network can give us without waiting), so we get pretty consistent read experience. “Read a buffered document” –> “Write to disk”. This has the effect of being able to teach the connection how fast we can read & process the results, giving us much better behavior as far as the network stack is concerned.
  • We play well with the rest of the system. By utilizing the transaction merger, we’ll work well with concurrent work on the server, instead of fighting for the same resources.

The code still need some work (resource handling, better error management, etc), but it is a new win in terms of simplicity and manageability.

But what about performance? Previously we have spread the load across many threads, on both client & server ends. That gave us faster overall performance at the cost of much higher complexity.

As it turns out, quite a lot of the benefit of bulk insert is related to the fact that we have just a single network connection going on, and we have that. We get some parallelism between writing the documents and reading from the network, but that is intentionally limited (to avoid fooling the other side that we can keep up with that rate of reads if we have  an I/O stall).

But let us assume that you have really need to be able to insert a lot of data into the database? Fast enough and large enough that you want us to be even faster?

That is actually quite easy. Remember how many times I said that this new system play well with other operations? This is important, because if you want to have faster performance for bulk insert… just run parallel bulk inserts. This way, you’ll have multiple threads on the server side reading & parsing, and all of that work will go (together) to the transaction merger), giving us a much better overall performance.

In our benchmarks, we actually had issues with data generation on the client side causing a major slowdown. We had to pre-generate all the data upfront, and only then start the bulk insert process, otherwise the call to Random to generate the data would have enough of an impact on the overall benchmark test. I don’t think that you’ll be able to generate the data fast enough to saturate a single bulk insert connection easily, but given how easy concurrency has became, if you can, the scale up option is incredibly easy.

time to read 3 min | 436 words

You might have noticed something very strange in all my posts about performance work. I’m always talking about performance of either specific small pieces, or showing the difference between old and new code in percentages.

This is quite intentional, we are not ready yet to publish benchmark results. But the reason isn’t that we are too slow. Across the board, we are looking at a minimum of an order of magnitude improvement, and in many cases, several orders of magnitude improvements. The reason that we don’t publish benchmark it actually very simple, we aren’t done yet.

A few days ago I published some of the changes that we were doing around JSON parsing. As you can imagine for a JSON Document Database, JSON parsing is a crucial part of our workload, and any miniscule difference there can have a widespread impact on the whole system.

When we started with RavenDB 4.0, one of the first things we did was write our own unmanaged JSON parser. In Jan 2016, we run a benchmark that gave us a parsing cost of 170  μs per document parse using JSON.Net, while our code code parse it in 120  μs, giving us 40% benefit over JSON.NET. Those numbers actually lie, because JSON.Net also does managed allocations, while our parser don’t, giving us far reduced actual cost overall.

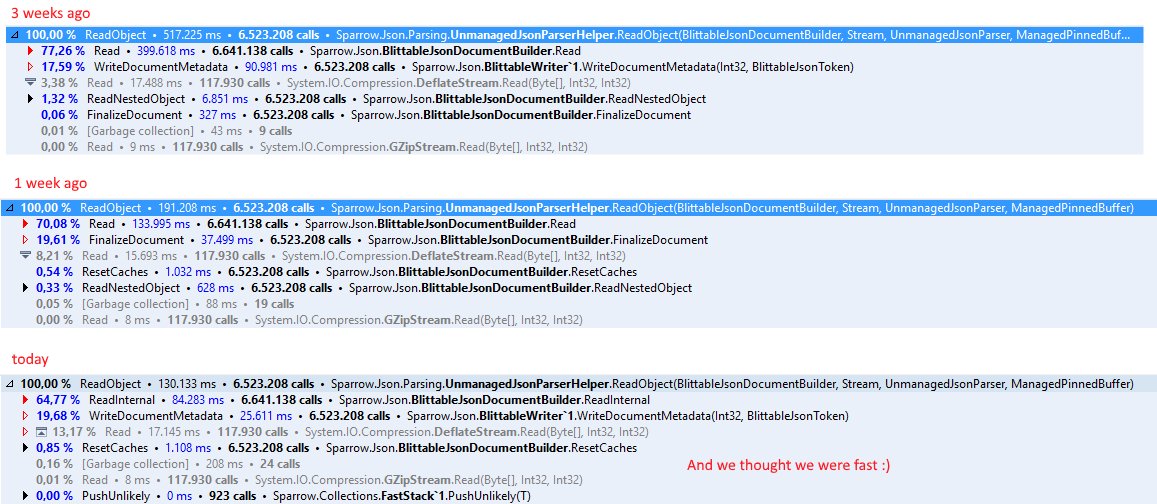
Getting 40% performance increase (and no future GC debt) is amazing, but in the year since, we have made a lot more changes. Here are some numbers from the performance team for the recent spate of work in that area. You can also see the details on the image on the right.

  • T – 3 weeks (our current baseline, with a lot of performance work since Jan 2016): 80 μs per document, and this time, the documents are much bigger than the previous benchmark we run.
  • T – 1 week: 30 μs per document.
  • T: 20 μs per document.

And at that point, we were done, and moved on to optimize other parts.

  • T + 2 days: 17 μs per document.

We weren’t even looking at that part, but optimizations in different areas meant that we were able to be even more efficient. That is about 17% higher.

And we still have about a month before we go into code freeze for the beta release.

Once that is done, we already have a plan to do a few round of benchmark / optimization / benchmark, and then publish the full results. I’m really excited about this.

time to read 2 min | 368 words

In many respects, HttpClient is much better than using the old WebRequest API. It does a lot more for you and it is much easier to use in common scenarios.

In others, the API is extremely constraining. One such example is when you want to do incremental generation of the request (maybe based on other things that are going on). Using WebRequest, this is trivial, you get the request stream, and just start writing to it, but with HttpClient, the actual request stream is hidden several layers too deep to be very useful.

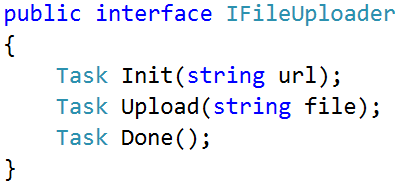
Sure, you can use PushStreamContent to actually generate the data to write to the stream, but it doesn’t help if you need to be called with more information. For example, let us imagine the following interface:

image

It is a pretty silly one, but it should explain things. We are first calling Init, and passing it the url we want to POST to, and then we upload multiple files to the servers. Using HttpClient, the usual way would be to gather all the file names during the Upload method, and then use PushStreamContent to push it all to the server in the Done method.

This is awkward if we have a lot of files, or if we want to generate and delete them after the upload. Luckily, we can cheat and get the same behavior as we can in WebRequest. Let us examine the code:

The first thing we do is spin a POST request to the server, but we are doing something strange, instead of generating the data when we are called on SerializeToStreamAsync, we are exposing it outside, and then returning another task. Effectively, we are telling the HttpContent that we are busy now, and it shouldn’t bug us with details until we’ll let it know.

Then, we wait to get the stream, and then we can start uploading each file in turn. At the end, we need to let the HttpClient that we are done sending data to the server, at which point we just need to wait for the server response, and we are done.

time to read 1 min | 73 words

During the design process for the next release of RavenDB, we set ourselves a pretty crazy goal. We wanted to get a tenfold performance improvement across the board…

This is how my article about gaining 600x performance improvement the the new DZone Guide - Performance: Optimization & Monitoring starts. For the rest, head there and read it all Smile.

time to read 2 min | 332 words

I’ve been writing a lot about performance and optimizations, and mostly I’m giving out percentages, because it is useful to compare to before the optimizations.

But when you start looking at the raw numbers, you see a whole different picture.

On the left, we have RavenDB 4.0 doing work (import & indexing) over about 4.5 million documents. On the right, you have RavenDB 3.5, doing the same exact work.

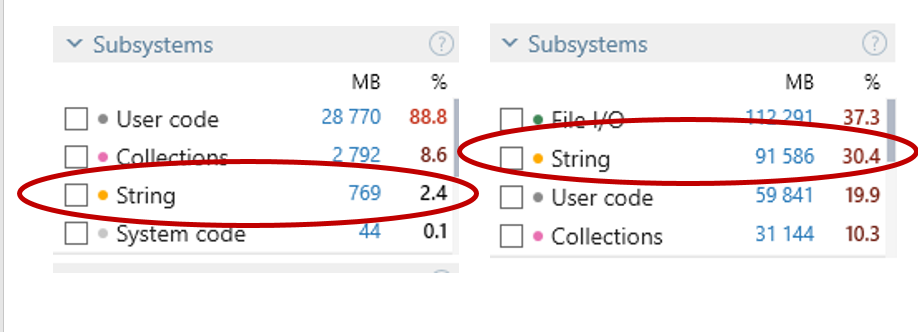
We are tracking allocations here, and this is part of a work we have been doing to measure our relative change in costs. In particular, we focused on the cost of using strings.

A typical application will use about 30% of memory just for strings, and you can see that RavenDB 3.5 (on the right) is no different.

image

On the other hand, RavenDB 4.0 is using just 2.4% of its memory for strings. But what is even more interesting is to look at the total allocations. RavenDB 3.5 allocated about 300 GB to deal with the workload, and RavenDB 4.0 allocated about 32GB.

image

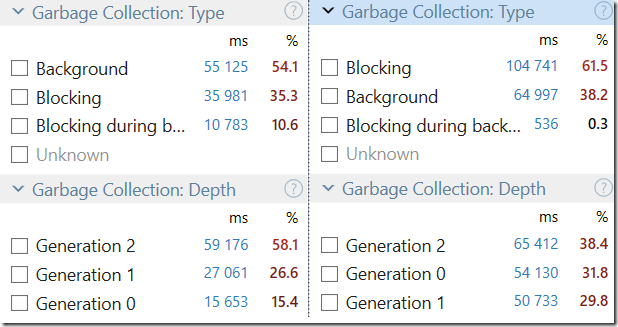
Note that those are allocations, not total memory used, but on just about every metric. Take a look at those numbers:

image

RavenDB 4.0 is spending less time overall in GC than RavenDB 3.5 will spend just on blocking collections.

Amusingly enough, here are the saved profile runs:

image

time to read 2 min | 372 words

One of the things that we did recently was go over our internal data structures in RavenDB and see if we can optimize them. Some of those changes are pretty strange if you aren’t following what is actually going on. Here is an example:

Before After

image

image[10]


What is the point in this kind of change? Well, let us look at the actual assembly generated by this, shall we?

Before After

As you can see, the second option is much shorter, and in the common case, it involves no actual jumping. This ends up being extremely efficient. Note that because we return a value from the ThrowForEmptyStack, the assembly generated is extremely short, since we can rely on the caller to clean us up.

This was run in release mode, CoreCLR, x64. I got the assembly from the debugger, so it is possible that there are some optimizations that hasn’t been applied because the debugger is attached, but it is fairly closed to what should happen for real, I think. Note that the ThrowForEmptyStack is inlined, even though it is an exception only method. If we use [MethodImpl(MethodImplOptions.NoInlining)], it will stop it, but the goto version will still generate better code.

The end result is that we are running much less code, and that makes me happy. In general, a good guide for assembly reading is that shorter == faster, and if you are reading assembly, you are very likely in optimization mode, or debugging the compiler.

I’m pretty sure that the 2.0 release of CoreCLR already fixed this kind of issues, by the way, and it should allow us to write more idiomatic code that generates very tight machine code.

time to read 2 min | 281 words

One of the most common issues that come up with performance tuning is that dictionaries are expensive. It isn’t so much that a single dictionary lookup is expensive, it is the sheer number of them. Dictionaries are used everywhere, and they are often used in very hot codepaths (as caching).

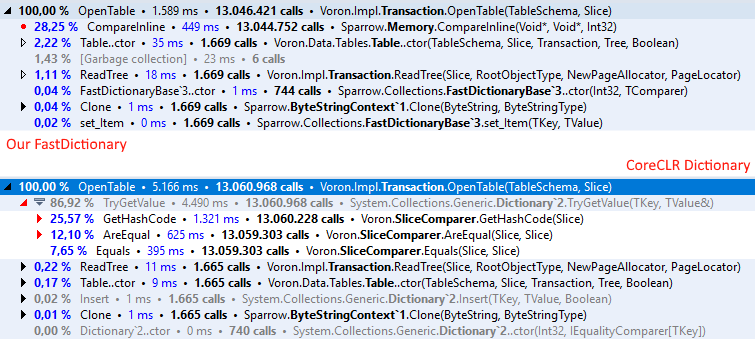
Numerous times we have dealt with that with trying to avoid the dictionary access (often favoring an array based lookup if we can get away with it). But at some point we have decided to implement our own dictionary. Here is how it looks like:

image

The actual dictionary impl is very close to the standard one, but that isn’t what make it fast. Note the generic argument? If we pass a struct implementing IEqualityComparer generic argument, then in most cases, the compiler and the JIT are going to generate code that is able to eliminate all virtual calls. And if there is a trivial equality comparison, that means that you can eliminate all calls and inline the whole thing inside that generic dictionary implementation.

In other words, we eliminate a minimum of two virtual calls per key lookup, and in some cases, we can eliminate even the method calls themselves, and that turn out to be quite important when the number of key lookups is in the billions.

^FEA545CC4AB39925FCF64214523354EF2E6493470066F1BD26^pimgpsh_fullsize_distr

And this is from midway through the optimizations.

time to read 2 min | 317 words

One of the most common operations in RavenDB is to load a document, make a simple change and save it back. Usually, we tell users to just rely on the change tracking on the session and just save the document, but while it is the easiest way, it isn’t always the best. If I have a large document, I might not want to send it all the way back to the server just for a small change. That is why RavenDB has had a Patch operation for a long time. But while we had this feature, it was always a bit clumsy. It either required you to build a patch request using a somewhat cryptic and limited object graph or to write your own inline javascript to make the modifications.

With RavenDB 4.0, we are introducing patching as a first class concept, baked directly into the session, for example:

In this case, we’ll send the server a request to update the last modified date when the SaveChanges method is called. The syntax is not all that I wish it could be, but we have to operate with the limitations that Linq syntax can accept.

A more interesting case is when you want to use patching not to reduce the network load, but to allow multiple concurrent operations on the document. Let us consider the case of adding a comment to this blog post. It is fine if two users post a comment at the same time, and we can express that using:

This gives us an easy way to express such things and expose a RavenDB capability that too few users has taken advantage of. Beneath the scenes, the Linq expressions are turned into JavaScript patches, which is then used to send just the right commands for the server to work with.

It’s a really cool feature, even if I so myself.

time to read 2 min | 354 words

RavenDB it meant to be a service that just runs and runs, for very long periods of time and under pretty much all scenarios. That means that as part of our testing, we are putting a lot of emphasis on its behavior. Amount of CPU used, memory utilization, etc. And we do that in all sort of scenarios. Because getting the steady state working doesn’t help if you have an issue, and then that issue kills you. So we put the system into a lot of weird states to see not only how it behaves, but what are the second order affects of that would be.

Once such configuration was a very slow network with a very short timeout setting, so effectively we’ll always be getting timeouts, and need to respond accordingly. We had a piece of code that is waiting for something to happen (an internal event, or a read from the network, or a timeout) and then does something accordingly.This is implemented as follows:

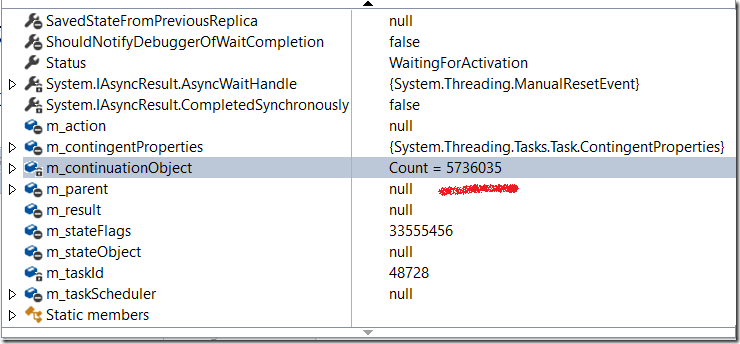
This is obviously extremely simplified, but it will reproduce the issue. If you will run this code, it will start using more and more memory. But why? On the face of it, this looks like a perfectly reasonable code.

What is actually happening is that the WaitAny will call CommonCWAnyLogic, which will call an AddCompletionAction on that task, which will track it, so we have a list of items there. So if we have a lot of waits on the same task, that is going to cause us to track all of those waits.

Here is what it looks like after a short while in the debugger.

image

And there is our memory leak.

The solution, by the way, was to not call WaitAny each time, but to call WhenAny, and then call Wait() on the resulting task, and keep that task around until it is completed, so we only register to the original event once.

FUTURE POSTS

No future posts left, oh my!

RECENT SERIES

  1. Challenge (75):
    01 Jul 2024 - Efficient snapshotable state
  2. Recording (14):
    19 Jun 2024 - Building a Database Engine in C# & .NET
  3. re (33):
    28 May 2024 - Secure Drop protocol
  4. Meta Blog (2):
    23 Jan 2024 - I'm a JS Developer now
  5. Production Postmortem (51):
    12 Dec 2023 - The Spawn of Denial of Service
View all series

RECENT COMMENTS

Syndication

Main feed Feed Stats
Comments feed   Comments Feed Stats
}