Oren Eini

CEO of RavenDB

a NoSQL Open Source Document Database

Get in touch with me:

oren@ravendb.net +972 52-548-6969

Posts: 7,520
|
Comments: 51,141
Privacy Policy · Terms
filter by tags archive
time to read 4 min | 622 words

A customer contacted us to complain about a highly unstable cluster in their production system. The metrics didn’t support the situation, however. There was no excess load on the cluster in terms of CPU and memory, but there were a lot of network issues. The cluster got to the point where it would just flat-out be unable to connect from one node to another.

It was obviously some sort of a network issue, but our ping and network tests worked just fine. Something else was going on. Somehow, the server would get to a point where it would be simply inaccessible for a period of time, then accessible, then not, etc. What was weird was that the usual metrics didn’t give us anything. The logs were fine, as were memory and CPU. The network was stable throughout.

If the first level of metrics isn’t telling a story, we need to dig deeper. So we did, and we found something really interesting. Here is the total number of TCP connections on the server over time.

So there are a lot of connections on the system, which is choking it? But the CPU is fine, so what is going on? Are we being attacked? We looked at the connections, but they all came from authorized machines, and the firewall was locked down tight.

unnamed

If you look closely at the graph, you can see that it hits 32K connections at its peak. That is a really interesting number, because 32K is also the number of ephemeral port range values for Linux. In other words, we basically hit the OS limit for how many connections could be sustained between a client and a server.

The question is what could be generating all of those connections? Remember, they are coming from a trusted source and are valid operations.  Indeed, digging deeper we could see that there are a lot of connections in the TIME_WAIT state.

We asked to look at the client code to figure out what was going on. Here is what we found:

There is… not much here, as you can see. And certainly nothing that should cause us to generate a stupendous amount of connections to the server. In fact, this is a very short process. It is going to run, read a single line from the input, write a document to RavenDB, and then exit.

To understand what is actually going on, we need to zoom out and understand the system at a higher level. Let’s assume that the script above is called using the following manner:

What will happen now? All of this code is pretty innocent, I’m sure you can tell. But together, we are going to get the following interesting behavior:

For each line in the input, we’ll invoke the script, which will spawn a separate process to connect to RavenDB, write a single document to the server, and exit. Immediately afterward, we'll have another such process, etc.

Each of those processes is going to have a separate connection, identified by a quartet of (src ip, src port, dst ip, dst port). And there are only so many such ports available on the OS. Once you close a connection, it is moved to a TIME_WAIT mode, and any packets that arrive for the specified connection quartet are going to be assumed to be from the old connection and drop. Generate enough new connections fast enough, and you literally lock yourself out of the network.

The solution to this problem is to avoid using a separate process for each interaction. Aside from alleviating the connection issue (which also requires non trivial cost on the server) it allows RavenDB to far better optimize network and traffic patterns.

time to read 3 min | 417 words

A customer called us, quite upset, because their RavenDB cluster was failing every few minutes. That was weird, because they were running on our cloud offering, so we had full access to the metrics, and we saw absolutely no problem on our end.

During the call, it turned out that every now and then, but almost always immediately after a new deployment, RavenDB would fail some requests. On a fairly consistent basis, we could see two failures and a retry that was finally successful.

Okay, so at least there is no user visible impact, but this was still super strange to see. On the backend, we couldn’t see any reason why we would get those sort of errors.

Looking at the failure stack, we narrowed things down to an async operation that was invoked via DataDog. Our suspicions were focused on this being an error in the async machinery customization that DataDog uses for adding non-invasive monitoring.

We created a custom build for the user that they could test and waited to get the results from their environment. Trying to reproduce this locally using DataDog integration didn’t raise any flags.

The good thing was that we did find a smoking gun, a violation of the natural order and invariant breaking behavior.

The not so good news was that it was in our own code. At least that meant that we could fix this.

Let’s see if I can explain what is going on. The customer was using a custom configuration: FastestNode. This is used to find the nearest / least loaded node in the cluster and operate from it.

How does RavenDB know which is the fastest node? That is kind of hard to answer, after all. It checks.

Every now and then, RavenDB replicates a read request to all nodes in the cluster. Something like this:

The idea is that we send the request to all the nodes, and wait for the first one to arrive. Since this is the same request, all servers will do the same amount of work, and we’ll find the fastest node from our perspective.

Did you notice the cancellation token in there? When we return from this function, we cancel the existing requests. Here is what this looks like from the monitoring perspective:

image

This looks exactly like every few minutes, we have a couple of failures (and failover) in the system and was quite confusing until we figured out exactly what was going on.

time to read 3 min | 541 words

We got a support call from a client, in the early hours of the morning, they were getting out-of-memory errors from their database and were understandably perturbed by that. They are running on a cloud system, so the first inclination of the admin when seeing the problem was deploying the server on a bigger instance, to at least get things running while they investigate. Doubling and then quadrupling the amount of memory that the system has had no impact. A few minutes after the system booted, it would raise an error about running out of memory.

Except that it wasn’t actually running out of memory. A scenario like that, when we give more memory to the system and still have out-of-memory errors can indicate a leak or unbounded process of some kind. That wasn’t the case here. In all system configurations (including the original one), there was plenty of additional memory in the system. Something else was going on.

When our support engineer looked at the actual details of the problem, it was quite puzzling. It looked something like this:

System.OutOfMemoryException: ENOMEM on Failed to munmap at Sparrow.Server.Platform.Posix.Syscall.munmap(IntPtr start, UIntPtr length);

That error made absolutely no sense, as you can imagine. We are trying to release memory, not allocate it. Common sense says that you can’t really fail when you are freeing memory. After all, how can you run out of memory? I’m trying to give you some, damn it!

It turns out that this model is too simplistic. You can actually run out of memory when trying to release it. The issue is that it isn’t you that is running out of memory, but the kernel. Here we are talking specifically about the Linux kernel, and how it works.

Obviously a very important aspect of the job of the kernel is managing the system memory, and to do that, the kernel itself needs memory. For managing the system memory, the kernel uses something called VMA (virtual memory area). Each VMA has its own permissions and attributes. In general, you never need to be aware of this detail.

However, there are certain pathological cases, where you need to set up different permissions and behaviors on a lot of memory areas. In the case we ran into, RavenDB was using an encrypted database. When running on an encrypted database, RavenDB ensures that all plain text data is written to memory that is locked (cannot be stored on disk / swapped out).

A side effect of that is that this means that for every piece of memory that we lock, the kernel needs to create its own VMA. Since each of them is operated on independently of the others. The kernel is using VMAs to manage its own map of the memory. and eventually, the number of the items in the map exceeds the configured value.

In this case, the munmap call released a portion of the memory back, which means that the kernel needs to split the VMA to separate pieces. But the number of items is limited, this is controlled by the vm.max_map_count value.

The default is typically 65530, but database systems often require a lot more of those. The default value is conservative, mind.

Adjusting the configuration would alleviate this problem, since that will give us sufficient space to operate normally.

time to read 2 min | 393 words

A customer reported a scenario where RavenDB was using stupendous amounts of memory. In the orders of tens of GB on a system that didn’t have that much load.

Our first suspicion was that this is an issue with reading the metrics, since RavenDB will try to keep as much of the data in memory, which sometimes leads users to worry. I spoke about this at length in the past.

In this case, that wasn’t the case. We were able to drill down into the exact cause of the memory usage and we found out that RavenDB was using an abnormally high amount of memory. The question was why that was, exactly.

We looked into the common operations on the server, and we found a suspicious query, it looked something like this:

from index 'Sales/Actions'
where endsWith(WorkflowStage, '/Final')

The endsWith query was suspicious, so we looked into that further. In general, endsWith requires us to scan all the unique terms for a particular field, but in most cases, there aren’t that many unique values for a field. In this case, however, that wasn’t the case, here are some of the values for WorkflowStage:

  • Workflows/3a1af12a-b5d2-4c96-9348-177ebaacab6c/Step-2
  • Workflows/6aacc86c-2f28-4b8b-8dee-1024314d5add/Final

In total, there were about 250 million sales in the database, each one of them with a unique WorflowStage value.

What does this mean, in terms of RavenDB query execution? Well, the fields are indexed, but we need to effectively do:

This isn’t the actual code, but it will show you what is going on.

In other words, in order to process this query, we have to scan (and materialize) all 250 million unique terms for this field. Obviously that is going to consume a lot of memory.

But what is the solution to that? Instead of doing an expensive endsWith query, we can move the computation from the query time to the index time.

In other words, instead of indexing the WorkflowStage field  as is, we’ll extract the information we want from it. The index would have one of those:

IsFinalWorkFlowStage = doc.WorkflowStage.EndsWith(“/Final”),

WorkflowStagePostfix = doc.WorkflowStage.Split(‘/’).Last()

The first one will check whether the value is final or not, while the second just gets the (one of hopefully a few) postfixes for the field. We can then query using equality instead of endsWith, leading to far better performance and greatly reduced memory usage, since we don’t need to materialize any values during the query.

time to read 2 min | 277 words

image A user of ours called us, quite frantic. They are running a lot of systems on RavenDB, and have been for quite some time.

However, very recently they started to run into severe issues. RavenDB would complain that there isn’t sufficient memory to run.

The system metrics, however, said that there are still gobs of GBs available (I believe that this is the appropriate technical term).

After verifying the situation, the on-call engineer escalated the issue. The problem was weird. There was enough memory, for sure, but for some reason RavenDB would be unable to run properly.

An important aspect is that this user is running a multi-tenant system, with each tenant being served by its own database. Each database has a few indexes as well.

Once we figured that out, it was actually easy to understand what is going on.

There are actually quite a few limits that you have to take into account. I talked about them here. In that post, the issue was the maximum number of tasks defined by the system. After which, you can no longer create new threads.

In this case, the suspect was: vm.max_map_count.

Beyond just total memory, Linux has a limit on the number of memory mappings that a process may have. And RavenDB uses Voron, which is based on mmap(), and each database and each index typically have multiple maps going on.

Given the number of databases involved…

The solution was to increase the max_map_count and add a task for us, to give a warning to the user ahead of time when they are approaching the system's limits.

time to read 11 min | 2005 words

imageA user reported that they observed nodes in the cluster “going dark”. Basically, they would stop communicating with the rest of the cluster, but would otherwise appear functional. Both the internal and external metrics were all fine, the server would just stop responding to anything over the network. The solution for the problem was to restart the service (note, the service, not the whole machine), but the problem would happen every few days.

As you can imagine, we are taking this sort of thing very seriously, so we looked into the problem. And we came up short. The problem made absolutely no sense. The problem occurred on a (minor) version migration, but there was absolutely nothing related to this that could cause it. What was really weird was that the service itself continue to work. We could see log entries being written and it was able to execute scheduled backups, for example. It would just refuse to talk to us over the network.

That was super strange, since the network itself was fine. All the monitoring systems were green, after all. For that matter, the user was able to SSH into the system to restart the service. This didn’t match with any other issue we could think of. Since the user worked around the problem by restarting the server, we didn’t have a lead.

Then we noticed the exact same problem in one of our cloud instances, and there we have much better diagnostic capabilities. Once we had noticed a problematic server, we were able to SSH into that and try to figure out what was going on.

Here is what we found out:

  • The server will not respond to HTTP(s) communication either from outside the machine or by trying to connect from inside the machine.
  • The server will respond to SNMP queries both from inside the machine and outside of it (which is how we typically monitor the system).

When we designed RavenDB, we implemented a “maintenance hatch” for such scenarios, in addition to using HTTP(s) for communication, RavenDB also exposes a named pipe that allows you to connect to the server without going through the network at all. This ensures that if you have administrator privileges on the server, you are able to connect even if there are network issues, certificate problems, etc.

Here is the kicker. Under this particular situation, we could not activate this escape hatch. That is not supposed to be possible. Named pipes on Linux, where we run into the problem, are basically Unix Sockets. A network issue such as a firewall problem or something similar isn’t going to affect them.

At the same time, we were able to communicate with the process using SNMP. What is the problem?

Lacking any other options, we dumped the process, restarted the service, and tried to do the analysis offline. We couldn’t find any problem. All the details we looked at said that everything was fine, the server was properly listening to new connections and it should work. That was… weird.

And then it happened again, and we did the same analysis, and it came back the same. We were clueless. One of the things that we updated between versions was the .NET runtime that we were using, so we opened an issue to see if anyone ran into the same problem.

And then it happened again. This time, we knew that just looking at the dump wouldn’t help us, so we tried other avenues. Linux has a pretty rich set of knobs and dials that you can look at to see what was going on. We suspected that this may be an issue with running out of file descriptors, running out of memory, etc.

We tried looking into what is going on inside the process using strace, and everything was fine. The trace clearly showed that the server was processing requests and was able to send and receive data properly.

Wait, go through that statement again please!

It is fine? But the reason we are using strace is that there is a problem. It looks like the problem fixed itself. That was annoying, because we were hoping to use the trace to figure out what is going on. We added more monitoring along the way, which would let us know if the server found itself isolated. And we waited.

The next time we ran into the problem, the first thing we did was run strace, we needed to get the root cause as soon as possible, and we were afraid that it would fix itself before we had a chance to get to the root cause. The moment we used strace, the server got back online, continuing as if there was never any issue.

Over the next few instances of this issue, we were able to confirm the following observations:

  1. The service would stop responding to TCP and Unix Sockets entirely.
  2. There were no firewall or network issues.
  3. The service was up and functional, tailing the log showed activity.
  4. We could query the server state using SNMP.
  5. Running strace on the service process would fix the problem.

There are a few more things, the actual trigger for the fix wasn’t strace itself. It was the ptrace() call, which it uses. That would cause the service to start responding again. The ptrace() call is basically the beginning and the end of debugging under Linux. Everything uses it.

If you want to dump a memory process, you start with ptrace(). You want to trace the calls, ptrace(). You want to debug the process? GDB will start by calling ptrace(), etc.

And doing that would alleviate the problem.

That was… quite annoying.

We still had absolutely no indication of what the root cause even was.

We suspected it may be something inside Kestrel that was causing a problem. But that wouldn’t affect the named pipes / Unix sockets that we also saw.

Networking worked, because SNMP did. We thought that this may be because SNMP uses UDP instead of TCP, and looked into that, but we couldn’t figure out how that would be any different.

Looking at this further, we found that we have this in the code dumps:

      ~~~~ 5072
         1 Interop+Sys.WaitForSocketEvents(IntPtr, SocketEvent*, Int32*)
         1 System.Net.Sockets.SocketAsyncEngine.EventLoop()
         1 System.Net.Sockets.SocketAsyncEngine+<>c.ctor>b__14_0(Object)

As you can see, we are waiting for this in the .NET Sockets thread. The SNMP, on the other hand, looked like:

Thread (0x559):
   [Native Frames]
   System.Net.Sockets!System.Net.Sockets.SocketPal.SysReceive()
   System.Net.Sockets!System.Net.Sockets.SocketPal.TryCompleteReceiveFrom()
   System.Net.Sockets!System.Net.Sockets.SocketAsyncContext.ReceiveFrom()
   System.Net.Sockets!System.Net.Sockets.SocketPal.ReceiveFrom()
   System.Net.Sockets!System.Net.Sockets.Socket.ReceiveFrom()
   SharpSnmpLib.Engine!Lextm.SharpSnmpLib.Pipeline.ListenerBinding.AsyncReceive()

That was really interesting, since it meant that for sockets (both HTTP and Unix), we were always using async calls, but for SNMP, we were using the synchronous API. We initially suspected that this may be something related to the thread pool. Maybe we had something that blocked it, but it turns out to be a lot more interesting. Here is the code that is actually handling the SNMP:

var count = _socket.ReceiveFrom(buffer, ref remote);

Task.Factory.StartNew(() => HandleMessage(buffer, count, (IPEndPoint)remote));

In other words, we are actually reading from the socket in a blocking manner, but then processing the actual message using the thread pool. So being able to get results via SNMP meant the thread pool was well.

At this point we resulted to hair pulling, rubber ducking and in some instances, shaking our fists to heaven.

I reminded myself that I’m an adult with a bit of experience solving problems, and dug deeper. We started looking into how .NET is actually handling sockets in async mode. This end up here, doing a system call:

while ((numEvents = epoll_wait(port, events, *count, -1)) < 0 && errno == EINTR);

Reading through the man page for epoll_wait() I learned how epoll() works, that it is complex and that we need to be aware of level-triggered and edge-triggered options. Since .NET uses edge-triggered events (EPOLLET, which I keep reading as electronic chicken), we focused on that.

There are a lot of edge cases and things to cover, but everything we checked was handled properly. We finally had a good smoking gun. For some reason, we weren’t getting notifications from epoll(), even though we should. Using strace() or friends somehow fixes that.

We actually found the exact scenario we saw in StackOverflow, but without any idea what the issue was. Truly, there is an XKCD for everything.

Our current understanding of the issue:

  • All async sockets in .NET are going through the same socket engine, and are using epoll() under the covers.
  • SNMP is using synchronous calls, so it wasn’t using epoll().

That covers both of the weird things that we are seeing. So what is the issue?

It is not in .NET. Given the size & scope of .NET, we wouldn’t be the only ones seeing that. Below .NET, there is the kernel, so we looked into that. The machines we were running that on were using kernel 5.4.0-azure-1095, so we looked into that.

And it looked like it is a kernel bug, which was fixed in the next updated kernel. A race condition inside the kernel would cause us to miss wakeups, and then we would basically just stall without anything to wake us up.

We dug deeper to understand a bit more about this situation, and we got this:

       Some system calls return with EINTR if a signal was sent to a
       tracee, but delivery was suppressed by the tracer.  (This is very
       typical operation: it is usually done by debuggers on every
       attach, in order to not introduce a bogus SIGSTOP).  As of Linux
       3.2.9, the following system calls are affected (this list is
       likely incomplete): epoll_wait(2), and read(2) from an inotify(7)
       file descriptor.  The usual symptom of this bug is that when you
       attach to a quiescent process with the command

           strace -p <process-ID>

       then, instead of the usual and expected one-line output such as

           restart_syscall(<... resuming interrupted call ...>_

       or

           select(6, [5], NULL, [5], NULL_

       ('_' denotes the cursor position), you observe more than one
       line.  For example:

               clock_gettime(CLOCK_MONOTONIC, {15370, 690928118}) = 0
               epoll_wait(4,_

       What is not visible here is that the process was blocked in
       epoll_wait(2) before strace(1) has attached to it.  Attaching
       caused epoll_wait(2) to return to user space with the error
       EINTR.  In this particular case, the program reacted to EINTR by
       checking the current time, and then executing epoll_wait(2)
       again.  (Programs which do not expect such "stray" EINTR errors
       may behave in an unintended way upon an strace(1) attach.)

And.. that is exactly what is happening. On attaching, the epoll_wait() will return with EINTR, which will cause .NET to retry the command, and that “fixes” the issue.

It makes total sense now, and concludes the discovery process of a pretty nasty bug.

Now, if you’ll excuse me, I need to go and apologize to a rubber duck.

image

time to read 3 min | 457 words

A customer called us with a problem. They set up a production cluster successfully, they could manually verify that everything is working, except that it would fail when they try to connect to it via the client API.

The error in question looked something like this:

CertificateNameMismatchException: You are trying to contact host rvn-db-72 but the hostname must match one of the CN or SAN properties of the server certificate: CN=rvn-db-72, OU=UAT, OU=Computers, OU=Operations, OU=Jam, DC=example, DC=com, DNS Name=rvn-db-72.jam.example.com

That is… a really strange error. Because they were accessing the server using: rvn-db-72.jam.example.com, and that was the configured certificate for it. But for some reason the RavenDB client was trying to connect directly to rvn-db-72. It was able to connect to it, but failed on the hostname validation because the certificates didn’t match.

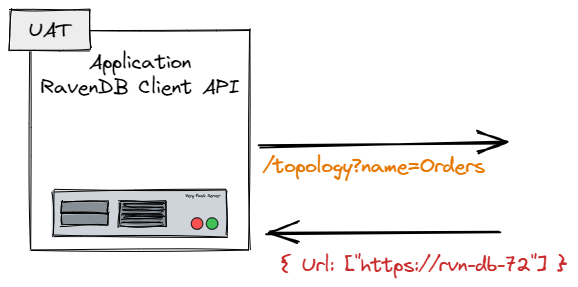
Initially, we suspected that there is some sort of a MITM or some network appliance that got in the way, but we finally figured out that we had the following sequence of events, shown in the image below. The RavenDB client was properly configured, but when it asked the server where the database is, the server would give the wrong URL, leading to this error.

image

This deserves some explanation. When we initialize the RavenDB client, one of the first things that the client does is query the cluster for the URLs where it can find the database it needs to work with. This is because the distribution of databases in a cluster doesn’t have to match the nodes in the cluster.

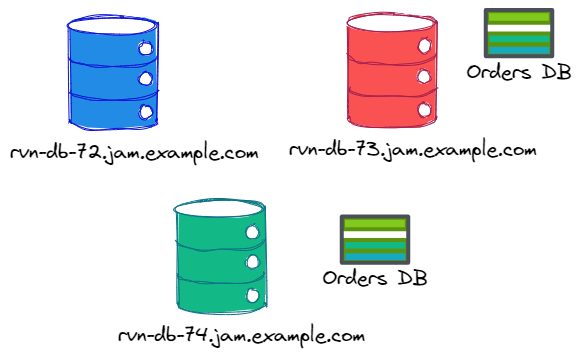
Consider this setup:

image

In this case, we have three nodes in the cluster, but the “Orders DB” is located only on two of them. If we query the rvn-db-72 database for the topology of “Orders DB”, we’ll get nodes rvn-db-73 and rvn-db-74. Here is what this will look like:

image

Now that we understand what is going on, what is the root cause of the problem?

A misconfigured server, basically. The PublicServerUrl for the server in question was left as the hostname, instead of the full domain name.

This configuration meant that the server would give the wrong URL to the client, which would then fail.

This is something that only the client API is doing, so the Studio behaved just fine, which made it harder to figure out what exactly is going on there. The actual fix is trivial, naturally, but figuring it out took too long. We’ll be adding an alert to detect and resolve misconfigurations like that in the future.

time to read 6 min | 1157 words

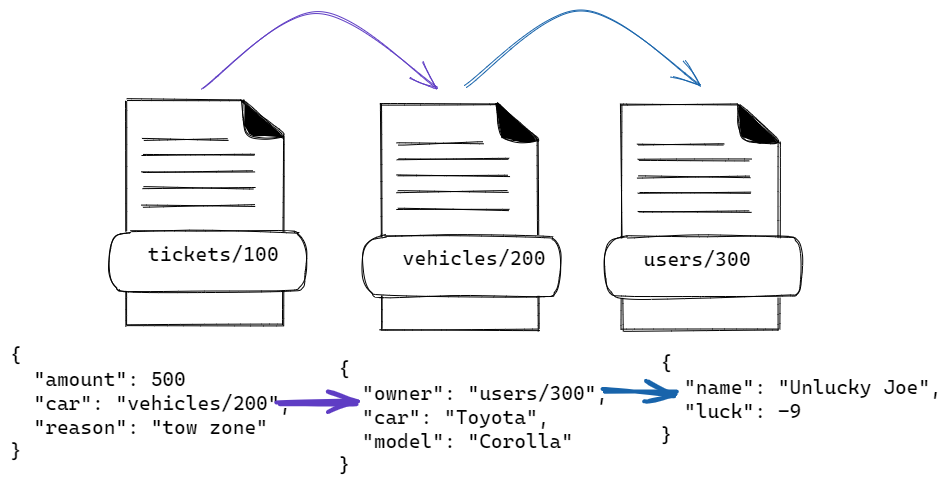
RavenDB has a really nice feature, it allows you to index data from related documents. Consider the following document structure:

image

We have tickets, vehicles, and users, and we want to issue a search on all the tickets issued to Joe. Leaving aside whether this is the proper way to handle this, here is what the index would look like:

What we are doing here is walk the reference graph and index data from related documents. So far, so good. The cool thing about this feature is that RavenDB is in charge of ensuring that if we update the owner of the vehicle or the name of the user, the Right Thing will happen.

Of course, I wouldn’t be writing this blog post if we didn’t run into a problem in this scenario.

The way it works, for each collection referenced by the index, RavenDB maintains a list of the last document that was chceked for changes in the collection. That way, on modification of a related document, we can tell that we need to re-index a particular document.

This looks something like this:

In other words, for each document that was loaded by another during indexing, we keep a list of the referencing documents.

Let’s say that we update document vehicles/200. That would be written to the storage with a new etag, and the index would wake up. It would ask to get all the documents in the Vehicles collection after etag 456, get vehicles/200 and then check the ReferencedBy and find that the document tickets/100 loaded it. At this point, it will re-index tickets/100 to ensure we have the latest values.

There is quite a bit more to this process, of course, I’m skipping on a lot of optimizations and detail work. For the purpose of this post, we don’t need any of that.

A customer reported that (very rarely), an index similar to the one above would “miss” on updates. That should not be possible. As much as I love this feature, conceptually, it is a very simple one, there isn’t much here that can fail. And yet, it did. Figuring out what was happening required us to look very deeply into the exact series of steps that were taken to produce this output. It turns out that our approach had a hole in it.

We assume that the writes would always happen in an orderly fashion. In other words, that the writes would be consistent. But there is no actual requirement for that.

Consider what happens if I write just the ticket document to the database:

  • RavenDB will index the ticket document
  • It will attempt to load the associated vehicle, figure out that there is no such document and move on
  • The related user document, of course, is not known at this point (since there is no vehicle document)

The end result is that we have the following data internally:

That is fine, when we’ll add the vehicle and the user, we’ll do the appropriate wiring, no?

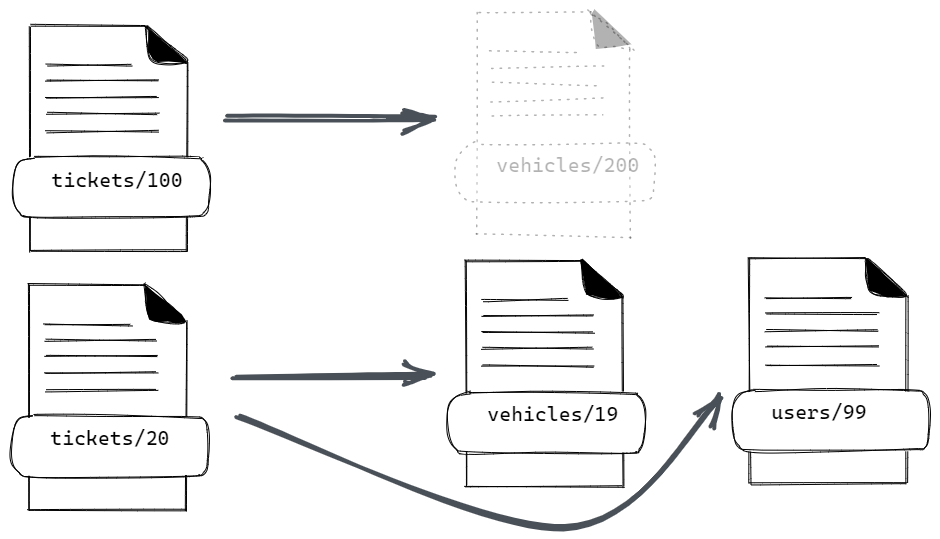
In almost all cases, that is exactly what will happen. However, consider the metadata above. We are concerned here with tickets/100, but there is also tickets/20, whose references exist properly. So the structure we have right now in terms of reference tracking is:

image

It’s important to note that the references are always kept from the initial 'tickets' document. So even though the path from tickets/20 to users/99 goes through vehicles/19, the relationship is a direct association.

What will happen if we’ll insert just the users/300 document now? Well, there is no reference to this document, so we’ve no reason to do anything with it. But that isn’t a problem. When vehicles/200 is inserted, this will be fixed.

On the other hand, if we add just vehicles/200 to the database (with users/300 not being present), that is a change in a tracked document, which will cause us to index the referencing document (tickets/100) again and move us to this state:

image

When we will then add users/300, document tickets/100 will have the record of this reference and we’ll re-index it.

In other words, we are covered on both sides. Except, that there is still this pesky (and impossible) problem that the user is seeing.

Now, consider the following state of affairs, we are back in the initial state, both vehicles/200 and users/300 are missing in the database and tickets/20, vehicles/19 and users/99 are there.

We add vehicles/200 to the database, and there is a re-indexing process going on. At the same time that we re-index tickets/100 because of the new vehicles/200 document, we are adding the users/300 document in a separate transaction.

That means that during the indexing of tickers/100, we’ll see document vehicles/200 but not the users/300 document (even though it exists).

That is still not a problem, we’ll write the referencing record and on the next batch, detect that we have a user that we haven’t seen and re-index the document again.

Except… what if we didn’t update just the users/300 document in this case, what if we also updated users/99 at the same transaction (and after we insert document users/300).

Depending on the exact timings, we may end up missing document users/300 (because there was no reference to it at the time) but will notice that document users/99 was updated (we already had it referenced). Since users/99 was modified after users/300, we’ll record that we observed all the changes in the Users collection before users/99. That, crucially, also includes the users/300 that we never noticed.

This is confusing, I’ll freely admit. In order to reproduce this bug you need a non-standard pattern for creating references, a chain of at least two references, multiple independent references with different states, and an unlucky draw from Murphy with the exact timing of transactions, indexing and order of operations.

The root cause was that we recorded the newly added document reference in memory, and only updated them when the entire indexing batch was completed. During that time, there may have been multiple transactions that modified the documents. But because we didn’t sync the state until the end of the batch, we would end up missing this case. Solving the problem once we knew what was going on involved moving a single line of code from the outer loop to an inner one, basically.

Writing a reproducible test case was actually far harder, since so many things had to fall just so this would happen. I have to admit that I don’t have any strong conclusions about this bug. It isn’t something systematic or an issue that we missed. It is a sequence of unfortunate events with a very low probability of occurring that we  never actually considered.

The really good thing about this issue is that it is the first one in this particular area of the code in quite some time. That means that this has been quite stable for many scenarios.

time to read 4 min | 636 words

A customer was experiencing large memory spikes in some cases, and we were looking into the allocation patterns of some of the queries that were involved. One of the things that popped up was a query that allocated just under 30GB of managed memory during its processing.

Let me repeat that, because it bears repeating. That query allocated 30(!) GB(!) during its execution. Now, that doesn’t mean that it was consuming 30 GB, it was just the allocations involved. Most of that memory was immediately discarded during the operation. But 30 GB of garbage to cleanup puts a lot of pressure on the system. We took a closer look at the offensive query. It looked something like this:

from index “Notifications/RoutingAndPriority”
where startsWith(Route, $routeKeyPrefix)
order by
Priority desc

That does not seem like a query that should be all that expensive. But details matter, so we dove into this. For this particular query, the routes are hierarchical structures that are unique for each message. Something like:

  • notifications/traffic/new-york-city/67a81019-941b-4d04-a0db-0559ed45343c
  • notifications/emergency/las-vegas/0a8e18fb-563b-4b6a-8e93-e10e08239656

And the queries that were generated were using the city & topic to filter the information that they were interested in.

The customer in question had a lot of notifications going on at all times. And each one of their Routes was unique. Internally, RavenDB uses Lucene (currently Smile ) to handle searches, and Lucene is using an inverse index to execute queries.

The usual way to think about is like this:

image

We have a list of terms (Brown, Green & Purple) and each of them has a list of the matching documents that contain the particular term.

The process of issuing a prefix query then is easy, scan all entries that match the prefix and return their results. This is indeed what Lucene is doing. However… while it is doing that, it will do something like this:

Pay close attention to what is actually happening here. There are two enumerators that we work with. One for the terms for the field and one for the documents for a specific term.

All of this is perfectly reasonable, but there is an issue. What happens when you have a lot of unique values? Well, then Lucene will have a lot of iterations of the loop. In this case, each term has just a single match, and Lucene is pretty good at optimizing search by specific term.

The actual problem is that Lucene allocates a string instance for each term. If we have 30 million notifications for New York’s traffic, that means that we’ll allocate 30 million strings during the processing of the query. We aren’t retaining these strings, mind. They’ll be cleaned up by the GC quickly enough, but that is an additional cost that we don’t actually want.

Luckily, in this case, there is a much simple solution. Given that the pattern of the route is known, we can skip the unique portion of the route. That means that in our index, we’ll do something similar to:

Route = doc.Route.Substring(0, doc.Route.LastIndexOf('/') + 1)

Once that is done, the number of unique matches there would be negligible. There would be no more allocations galore to observe and overall system performance is much improved.

We looked into whether there is something that we can do with Lucene to avoid this allocations issue, but it is endemic to the way the API works. The longer term plan is to fix that completely, of course. We are making great strides there already Smile.

In short, if you are doing startsWith() queries or similar, pay attention to the number of unique terms that you have to go through. A simple optimization on the index like the one above can bring quite a bit of dividends.

time to read 4 min | 653 words

RavenDB is written in C#, and as such, uses managed memory. As a database, however, we need granular control of our memory, so we also do manual memory management.

One of the key optimizations that we utilize to reduce the amount of overhead we have on managing our memory is using an arena allocator. That is a piece of memory that we allocate in one shot from the operating system and operate on. Once a particular task is done, we can discard that whole segment in one shot, rather than try to work out exactly what is going on there. That gives us a proper scope for operations, which means that missing a free in some cases isn’t the end of the world.

It also makes the code for RavenDB memory allocation super simple. Here is what this looks like:

image

Whenever we need to allocate more memory, we’ll just bump the allocator up. Initially, we didn’t even implement freeing memory, but it turns out that there are a lot of long running processes inside of RavenDB, so we needed to reuse the memory inside the same operation, not just between operations.

The implementation of freeing memory is pretty simple, as well. If we return the last item that we allocated, we can just drop the next allocation position by how many bytes were allocated. For that matter, it also allows us to do incremental allocations. We can ask for some memory, then increase the allocation amount on the fly very easily.

Here is a (highly simplified) example of how this works:

As you can see, there isn’t much there. A key requirement here is that you need to return the memory back in the reverse order of how you allocated it. That is usually how it goes, but what if it doesn’t happen?

Well, then we can’t reuse the memory directly. Instead, we’ll place them in a free list. The actual allocations are done on powers of two, so that makes things easier. Here is what this actually looks like:

image

So if we free, but not from the top, we remember the location and can use it again. Note that for 2048 in the image above, we don’t have any free items.

I’m quite fond of this approach, since this is simple, easy to understand and has a great performance profile.  But I wouldn’t be writing this blog post if we didn’t run into issues, now would I?

A customer reported high memory usage (to the point of memory exhaustion) when doing a certain set of operations. That… didn’t make any sense, to be honest. That was a well traveled code path, any issue there should have been long found out.

They were able to send us a reproduction and the support team was able to figure out what is going on. The problem was that the code in question did a couple of things, which altogether led to an interesting issue.

  • It allocated and deallocated memory, but not always in the same order – this is fine, that is why we have the free list, after all.
  • It extended the memory allocation it used on the fly – perfectly fine and an important optimization for us.

Give it a moment to consider how could these two operations together result in a problem…

Here is the sequence of events:

  • Loop:
    • Allocate(1024) -> $1
    • Allocate(256) -> $2
    • Grow($1, 4096) -> Success
    • Allocate(128) -> $3
    • Free($1) (4096)
    • Free($3) (128)
    • Free($2) (256)

What is going on here?

Well, the issue is that we are allocating a 1KB buffer, but return a 4KB buffer. That means that we add the returned buffer to the 4KB free list, but we cannot pull from that free list on allocation.

Once found, it was an easy thing to do (detect this state and handle it), but until we figured it out, it was quite a mystery.

FUTURE POSTS

No future posts left, oh my!

RECENT SERIES

  1. Challenge (75):
    01 Jul 2024 - Efficient snapshotable state
  2. Recording (14):
    19 Jun 2024 - Building a Database Engine in C# & .NET
  3. re (33):
    28 May 2024 - Secure Drop protocol
  4. Meta Blog (2):
    23 Jan 2024 - I'm a JS Developer now
  5. Production Postmortem (51):
    12 Dec 2023 - The Spawn of Denial of Service
View all series

RECENT COMMENTS

Syndication

Main feed Feed Stats
Comments feed   Comments Feed Stats
}