Oren Eini

CEO of RavenDB

a NoSQL Open Source Document Database

Get in touch with me:

oren@ravendb.net +972 52-548-6969

Posts: 7,520
|
Comments: 51,141
Privacy Policy · Terms
filter by tags archive
time to read 5 min | 852 words

I mentioned that we are doing some work to enable de-virtualization of our code, as well as getting ready for CoreCLR changes that will get the JIT to do more de-virtualization.

I was asked (by Maayan) about this, more specifically:

How does manual de-virtualization work? AFAIK, the compiler always emits a CallVirt instruction for non-static method calls, regardless of weather the method is virtual or not (and regardless of weather the class is sealed or not). Are you extending the C# compiler and overriding the emission code? Are you re-JITting the code in runtime (as profilers do using the profiler API)?

And the answer is that Maayan is correct, C# is defined (for various reasons related to ECMA approval process over 15 years ago) to always dispatch methods using CallVirt. But CallVirt is an IL instruction, not an assembly one.

Here is some code for various code, as well as the relevant assembly being generated for it (CoreCLR 1.1, X64, Release). Don’t worry about the assembly, I have detailed explanations below for each part.

This is pretty simple (non inlined) set of methods that are just there to make sure that you can see what ends up actually running. The actual method just end up calling Console.WriteLine, but that is about it.

Now, let us inspect each of those behaviors one at a time, first let us look at how an interface dispatch work.

If you want the gory details, you can look for those  in the Book of the Runtime. But basically, we are jumping to a code location that will find the proper code that we need to execute. Note that there is still additional work there to actually route the method to the appropriate place, which is hidden from us by the runtime, JIT, etc.

Note that the funny cmp method there? It is there to generate a dereference of the address by the CPU, which will cause it raise a trap if the address is invalid, and if the address is 0, the CLR will convert that to a NullReferenceException.

Now, what about a virtual method call? That is actually simpler, since is it similar to how I learned it when I worked with C++.

Basically, at the end of the object we have a method table pointer, and we dereference that, and then another pointer to the specific method we want to invoke. Part of the reason that virtual calls are expensive is exactly this, we have to jump around in memory a lot, and that means that we both have to issue more instructions, and more to the point, we have to touch a lot more memory, which can can cause cache lines to be evicted, forcing us to stall.

What about a struct method call? To make things easier, I made sure that it couldn’t be inlined, which generated:

In this case, I’m using an empty struct, so it has as much size as a pointer, which is why you can see it being passed around like it was just a pointer. If I had a bigger struct, I would see very different code.

Why is the code simpler when the struct is bigger? Well, the answer is quite simple, we are looking at the actual method that was called with this parameter, but the job of actually sending the parameter is done by the caller, so we aren’t seeing it here.

What is going on is that as long as your struct is empty or have a single value that is an 4 / 8 bytes long, the CLR can optimize that to be a regular parameter, making it effectively free. In such cases, you can see the struct being passed around in registers (the struct itself, since it is copied, not the address to it).

However, if you have a struct that is composed of multiple fields, that require us to copy each field to the stack before call, which on large stacks can take a bit.

I mentioned that this was done with a struct that we disabled inlining for, what happens if we allow inlining (the default)?

This looks completely different then anything we have seen so far. And in fact, it is. What we are seeing here is the result of inlining the struct method invocation. Because the compiler was able to figure out what the end target of the call is, and because it is small enough to be inlined, we can skip calling the method entirely and just directly run the code.

As it turns out, this can have dramatic affect on performance (on both directions, mind), and something that you need to carefully consider when you analyze your application performance.

But the short of it is, the fewer jumps and dereferences we have, the better it is for us. And you can see the various methods (pun intended) that the CLR uses to dispatch them. In my next post, I’ll talk about how we can make use of this behavior.

time to read 2 min | 326 words

Following up on this post, I wondered what it would be like if I were to implement this with Voron. Given that Voron was explicitly designed to be a low level storage engine, suitable for varying needs, it is an interesting experiment.

Let us define upfront what we want to do:

We use BlittableJsonReaderObject as the key in the add because initializing a dictionary per add call would be ridiculously expensive. The blittable instance is much cheaper, and its associated memory can be cleaned when it is done much more easily.

Here is how we handle the append:

There isn’t much here, and that is quite intentional. What you are seeing here is transaction merging. Instead of having to compete on the same lock, we just place the value to be written on the queue, and wait for it to complete. The other side of that is the transaction merging itself:

Please note that I didn’t really focus on performance here, just to make sure that this is clear. Basically, we use the hash of the key as the time series id, and then we break the key into name/value pieces, and record the time series ids of all the series with that particular name/value. That allows us to get the list of all the series that match a particular name/value easily, and from there we can do more complex filtering.

We are using a FixedSizeTree for quite a lot, this is basically a tree whose key is always a long, and whose value is predefined (in this case, a double), and we just store that based on the time series id.

Querying this will require us to first find all the series that match the query, then find the relevant values in the time range for the specified series, and that is all Smile.

time to read 7 min | 1273 words

This is a fascinating post about building a time series database from scratch. The author explicitly warns that they have no background in databases, but given that this is my day job, I decided I might throw in my 2 cents about the way they do things.

Note: Large protion of the original post talk about their existing system (which they are replacing), and most of my criticisms are about that system. Where I'm talking about the new system (toward the end of this post) , I'm noting that explicitly.

I started writing this post about halfway through reading  the post, mostly because I got all sort of comments and wanted to keep a record of things as I’m reading it. It is possible that some of the things that I’m concerned about would be answered later in the post. Without further ado, my comments. It will probably won’t make sense without reading the original post.

They are storing their time series data using keys similar to:

{__name__="requests_total", path="/status", method="GET", instance=”10.0.0.1:80”}

And then they allow to do queries on both the keys and time (all GET requests on /status in the past week). I would have thought about this, but it it a very interesting way to handle queries on such an environment. They also seem to need to do queries that are both in the same series and across series, they call it vertical and horizontal queries.

Let's just consider the main take away: sequential and batched writes are the ideal write pattern for spinning disks and SSDs alike.

Yes, that is pretty much the key for good performance.

So ideally, samples for the same series would be stored sequentially so we can just scan through them with as few reads as possible. On top, we only need to know where this sequence starts to access all data points.

There's obviously a strong tension between the ideal pattern for writing collected data to disk and the layout that would be significantly more efficient for serving queries. It is the fundamental problem our TSDB has to solve.

Yes, being able both write efficiently and query efficiently are two very different problems that you need to handle, and often you need to select which one you’ll prefer.

We create one file per time series that contains all of its samples in sequential order.

What?! No, you can’t do that. At least, you can’t do that and get reasonable behavior. To start with, even though you are doing batch, you are actually guaranteeing that your write pattern would be random. Why is that?

Because if you are writing every KB (which is what they do) per file, you are basically ensuring that the OS will have to write to different sectors / pages on the physical drive. So if you have writes to 100 series, you are going to be writing to 100 different on disk locations. To make things worse, you aren’t writing in 4KB increments, which basically means that you are doing buffered writes. That information isn’t in the post, but it is a safe assumption, since if they weren’t doing buffered writes, there is no way that the operating system will be able to catch up with the kind of load. That in turn means that you don’t have any durability whatsoever.

In fact, this is mentioned explicitly, but only in the case of losing the writes made in the application buffer. I’m assuming that they either don’t care or have a different manner for avoiding / dealing with data loss / corruption in the case of machine failure. More to the point, given that they do compression, they need to be able to recover from partially written data to the files, and from the post, I don’t think that they are doing that.

But those issues are only just the start. On Windows, you don’t typically worry about the number of open files you have, but on Linux, there is a typical a limit on the number of open files you can have. It is common to have that around 64K max open files. Using a file per series means that you are very likely going to run into issues with the number of open files you have, in fact, it would be very easy to construct a query that would hit that limit, and that would have a global impact on the server.

Other issues with such large number of files is that file systems don’t really like it when you have so many files, this is discussed in the post as running out of inodes, but we have noticed performance degradation on directories with large number of files on a wide variety of file systems.

When you implement expiration of data, it also means that you have to move data from the middle of the file to the beginning, and then truncate it, that leads to a huge amount of additional I/O, likely blocking and is probably something that an operations guy is looking at.

Another issue is that because they have a file per series, they need to cache it aggressively, leading to competition between the database cache and the operation system page cache. It also means that the application is sensitive to allocation patterns, and on Linux, that is a really bad thing to do, because the silly OOM killer.

When querying data that is not cached in memory, the files for queried series are opened and the chunks containing relevant data points are read into memory. If the amount of data exceeds the memory available, Prometheus quits rather ungracefully by getting OOM-killed.

Yep, that was my first thought when I started reading this. I follow the reasoning on why OOM is there, but I still think it is a very silly choice.

The actual solution that they present is to have all the data for a particular time frame (2 hours, in their case) in a block directory. I’m not sure why they have a separate directory from block (with multiple chunks per block), and mmaping the whole thing. That is a far better solution, but they also implement compaction, which get you right back to write amplification, and I don’t quite get why. The example they give is that if you have a week long query, you don’t want to merge results across 80 blocks, but I would assume that this is surely better than having to write the same data over and over again.

If the series with IDs 10, 29, and 9 contain the label app="nginx", the inverted index for the label "nginx" is the simple list [10, 29, 9], which can be used to quickly retrieve all series containing the label.

This just screams at me that it is wrong. Oh, not the actual content, but look at the list, it should be [9, 10, 29], because working with the sorted data is going to enable so many more interesting scenarios. Oh, it seems like that is what they are doing in the new version, so that is good.

I think that I found the right location for the code, and this line scares me, basically, it means that this will issue an fsync once every 10 seconds. That means that there is a 10 seconds period of potential data loss. Given the data that is kept, that is probably not an issue, and losing 10 seconds of samples is likely not going to be an issue.

That means that you can basically do all writes to memory all the time, and that gives you a major performance boost all around, at the expense of safety.

This is an interesting enough topic that I’ll do another post, discussing how I’ll implement the same scenario with Voron.

time to read 2 min | 388 words

One of the nastier edge cases with TaskCompletionSource is that you can attach a continuation to that which will run synchronously. You can avoid that to a certain extent by using RunContinuationsAsynchronously, and that works, but under load, it can still be problematic.

In particular, consider the case where we have a task with:

  1. Do computation
  2. Enqueue a task to be completed by a different thread (getting a Task back)
  3. Continue computation until done
  4. Wait for previous operation to complete
  5. Go to 1

Even with avoiding running the continuation in sync mode, that still result in an issue. In particular, when we are running asynchronous continuation, that isn’t magic, that still need a thread to run on, and that will typically be a thread pool thread.

But if all the thread pool threads are busy doing the work above, it may force us to wait until we are done with the computation that the code is running, to pull some more work from the thread pool queue until the queue gets to the notification that we are ready to work. In other words, we may suffer from jitter, where the running task is waiting for an already complete async operation, but it doesn’t know it (and hence give up the thread) because there wasn’t any available thread to run it.

We resolve it by adding a dedicated thread, which simply wait for those notifications, and run only them. Because those are typically very short, and there isn’t that many of them, it means that we can process them very quickly. In order to prevent us from having stalls on that thread, we use what I think is a pretty nifty trick.

We are registering the event twice, once on our dedicated thread, and once on the normal thread pool. If somehow the dedicated thread is too busy, the thread pool (and its auto growth) will handle it, but most of the time, the dedicated thread can catch it and run it.

And adding a basically noop task to the thread pool isn’t going to generate any pressure on the thread pool if there is no load, and if there is load, it will encourage it to grow faster, which is what we want.

If you care to look at the code, it is here.

time to read 3 min | 480 words

I have been re-thinking about some of my previous positions with regards to development, and it appear that I have been quite wrong in the past.

In particular, I’m talking about things like:

Note that those posts are parts of a much larger discussion, and both are close to a decade old. They aren’t really relevant anymore, I think, but it still bugs me, and I wanted to outline my current thinking on the matter.

C# is non virtual by default, while Java is virtual by default. That seems like a minor distinction, but it has huge implications. It means that proxying / mocking / runtime subclassing is a lot easier with Java than with C#. In fact, a lot of frameworks that were ported from Java rely on this heavily, and that made it much harder to use them in C#. The most common one being NHibernate, and one of the chief frustrations that I kept running into.

However, given that I’m working on a database engine now, not on business software, I can see a whole different world of constraints. In particular, a virtual method call is significantly more expensive than a direct call, and that adds up quite quickly. One of the things that we routinely do is try to de-virtualize method calls using various tricks, and we are eagerly waiting .NET Core 2.0 with the de-virtualization support in the JIT (we already start writing code to take advantage of it).

Another issue is that my approach to software design has significantly changed. Where I would previously do a lot of inheritance and explicit design patterns, I’m far more motivated toward using composition, instead. I’m also marking very clear boundaries between My Code and Client Code. In My Code, I don’t try to maintain encapsulation, or hide state, whereas with stuff that is expected to be used externally, that is very much the case. But that give a very different feel to the API and usage patterns that we handle.

This also relates to abstract class vs interfaces, and why you should care. As a consumer, unless you are busy doling some mocking or so such, you likely don’t, but as a library author, that matters a lot to the amount of flexibility you get.

I think that a lot of this has to do with my view point, not just as an Open Source author, but someone who runs a project where customers are using us for years on end, and they really don’t want us to make any changes that would impact their code. That lead to a lot more emphasis on backward compact (source, binary & behavior), and if you mess it up, you get ricochets from people who pay you money because their job is harder.

time to read 1 min | 111 words

I run into the following bit of code while doing a code review on a pull request:

This was very strange, because the code appeared to compile properly, but it shouldn’t. I mean, look at it. The generic parameter is not constrained, and I don’t have any extension methods on Object that can apply here, so why would this compile?

The secret was in the base class:

Basically, we specified the constraint on the abstract method, and then inherited it, which was really confusing to me until I figured it out.

You can’t do the same with interfaces, though, although explicit interface implementation does allow it.

time to read 4 min | 781 words

During benchmarking RavenDB, we have run into several instances where the entire machine would freeze for a long duration, resulting in utter non responsiveness.

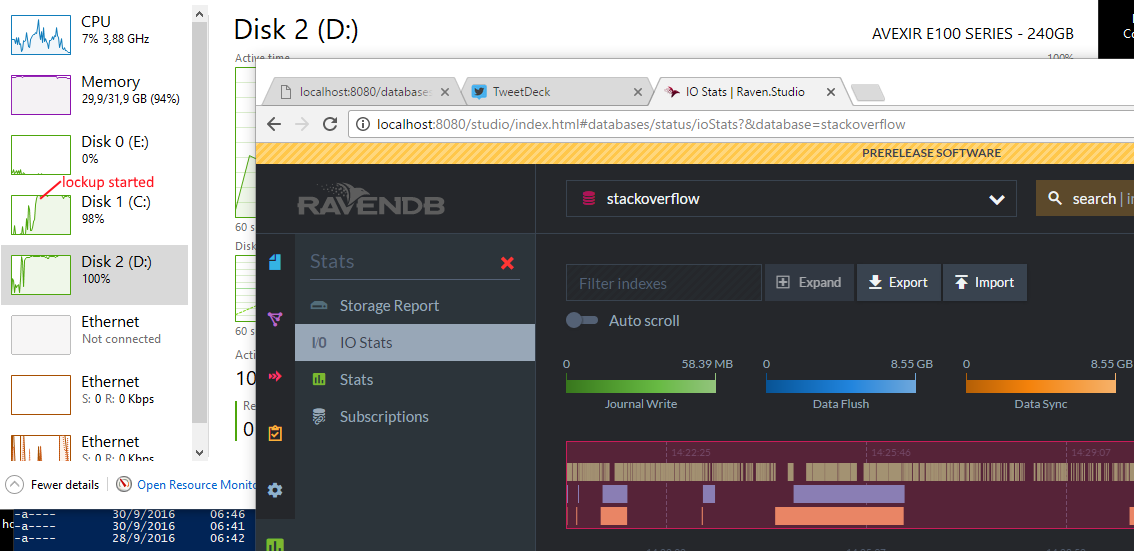
This has been quite frustrating to us, since a frozen machine make it kinda hard to figure out what is going on. But we finally figured it out, and all the details are right here in the screen shot.

image

What you can see is us running our current benchmark, importing the entire StackOverflow dataset into RavenDB. Drive C is the system drive, and drive D is the data drive that we are using to test our RavenDB’s performance.

Drive D is actually a throwaway SSD. That is, an SSD that we use purely for benchmarking and not for real work. Given the amount of workout we give the drive, we expect it to die eventually, so we don’t want to trust it with any other data.

At any rate, you can see that due to a different issue entirely, we are now seeing data syncs in excess of 8.5 GB. So basically, we wrote 8.55GB of data very quickly into a memory mapped file, and then called fsync. At the same time, we started increasing our  scratch buffer usage, because calling fsync ( 8.55 GB ) can take a while. Scratch buffers are a really interesting thing, they were born because of Linux crazy OOM design, and are basically a way for us to avoid paging. Instead of allocating memory on the heap like normal, which would then subject us to paging, we allocate a file on disk (mark it as temporary & delete on close) and then we mmap the file. That give us a way to guarantee that Linux will always have a space to page out any of our memory.

This also has the advantage of making it very clear how much scratch memory we are currently using, and on Azure / AWS machines, it is easier to place all of those scratch files on the fast temp local storage for better performance.

So we have a very large fsync going on, and a large amount of memory mapped files, and a lot of activity (that modify some of those files) and memory pressure.

That force the Kernel to evict some pages from memory to disk, to free something up. And under normal conditions, it would do just that. But here we run into a wrinkle, the memory we want to evict belongs to a memory mapped file, so the natural thing to do would be to write it back to its original file. This is actually what we expect the Kernel to do for us, and while for scratch files this is usually a waste, for the data file this is exactly the behavior that we want. But that is beside the point.

Look at the image above, we are supposed to be only using drive D, so why is C so busy? I’m not really sure, but I have a hypothesis.

Because we are currently running a very large fsync, I think that drive D is not currently process any additional write requests. The “write a page to disk” is something that has pretty strict runtime requirements, it can’t just wait for the I/O to return whenever that might be. Consider the fact that you can open a memory mapped file over a network drive, I think it very reasonable that the Kernel will have a timeout mechanism for this kind of I/O. When the pager sees that it can’t write to the original file fast enough, it shrugs and write those pages to the local page file instead.

This turns an  otherwise very bad situation (very long wait / crash) into a manageable situation. However, with the amount of work we put on the system, that effectively forces us to do heavy paging (in the orders of GBs) and that in turn lead us to a machine that appears to be locked up due to all the paging. So the fallback error handling is actually causing this issue by trying to recover, at least that is what I think.

When examining this, I wondered if this can be considered a DoS vulnerability, and after careful consideration, I don’t believe so. This issue involves using a lot of memory to cause enough paging to slow everything down, the fact that we are getting there in a somewhat novel way isn’t opening us to anything that wasn’t there already.

time to read 1 min | 150 words

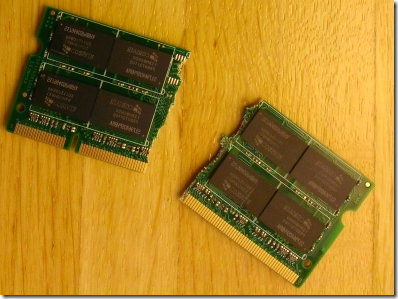
imageSo we got an emergency support call during the Passover holiday, and as you can imagine, it was a strange one. Our investigation of the error basically boiled down (cutting down a lot of effort in between): “This can’t be happening.”

I hate this kind of answer, because it usually means that we are missing something. Usually that can be a strange error code, some race condition or just something strange about the environment.

While we were working the problem, the customer came back with, “Oh, we found the issue. A memory unit went rogue, and the firmware wasn’t able to catch it.” When they updated the firmware, it apparently caught it immediately.

So I guess we can close this support incident. Smile

RavenDB Bootcamp

time to read 1 min | 105 words

image

We have RavenDB Bootcamp ready to go. If you want to learn about RavenDB, we have 18 parts series that take you through working with RavenDB in easily digestible pieces.

You can either go through them all or register to get them once a day via email so it doesn’t take too much time all at once.

They are available in our docs, and it is a great way to learn RavenDB from nothing.

FUTURE POSTS

No future posts left, oh my!

RECENT SERIES

  1. Challenge (75):
    01 Jul 2024 - Efficient snapshotable state
  2. Recording (14):
    19 Jun 2024 - Building a Database Engine in C# & .NET
  3. re (33):
    28 May 2024 - Secure Drop protocol
  4. Meta Blog (2):
    23 Jan 2024 - I'm a JS Developer now
  5. Production Postmortem (51):
    12 Dec 2023 - The Spawn of Denial of Service
View all series

RECENT COMMENTS

Syndication

Main feed Feed Stats
Comments feed   Comments Feed Stats
}