Oren Eini

CEO of RavenDB

a NoSQL Open Source Document Database

Get in touch with me:

oren@ravendb.net +972 52-548-6969

Posts: 7,520
|
Comments: 51,141
Privacy Policy · Terms
filter by tags archive
time to read 6 min | 1026 words

In my last post I dove into the Epoch implementation. The Epoch is explained very nicely in the paper, and the code follows the paper pretty closely. The code make sense, but I still lack the proper… feeling for how it is actually being used. The Epoch allows you to register code that will be executed when the epoch is updated, which is the key to how FASTER is making progress, but while I can see that this is being called from the allocators, I haven’t really grokked it yet. I’m going to back to the faster.h file and see what I can glean from there.

Because of the template utilization, it is kinda hard to figure out what exactly is going on, I’m going to look at some of the examples and try to figure out what it is doing there. Here is one instance of this class:

image

AdId and NumClicks are just two ways to provide operations on 8 bytes keys and values. I like these examples because they provide good use case to talk about FASTER usage.

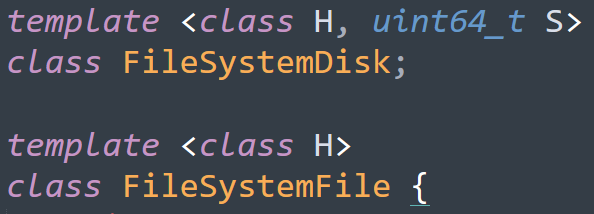
This code leads me to the FileSystemDisk, which is defined as:

image

In the FileSystemFile, we have this code:

image

This is pretty simple, but I was quite amused by this, because this is C# API sneaking up again in the C++ code. There is also this:

image

I’m not sure what this bundle is, though. I run into this code in the class:

image

This is… not nice, in my eyes. Based on this code, whoever allocated this instance also allocated a buffer large enough to include more data there. This is fairly common, since you want to work with such data together, but I find it ugly / risky because it means that there are multiple locations that needs to be aware of it. I would like it better if they just passed the pointer explicitly. That would avoid this snippet:

image

Which I find pretty annoying to read. What is stranger is that to use this, you have to write (bundle_t has been typedef for the FileSystemSegmentBundle):

image

I get what is going on here, but I just find it really awkward to handle. There are multiple places where you need knowledge of this allocation pattern and I don’t believe that the benefit of placing all of the data together is that important. For that matter, given the importance of not using new explicitly in modern C++, I’m sure that there are other ways to achieve the same goal that would be more natural.

Going through the code, we now have:

image

I decided to make this post about the file system usage, because there is a lot of pretty complex code here that I would like to understand. I finally figured out what the S is, this is the segment size:

image

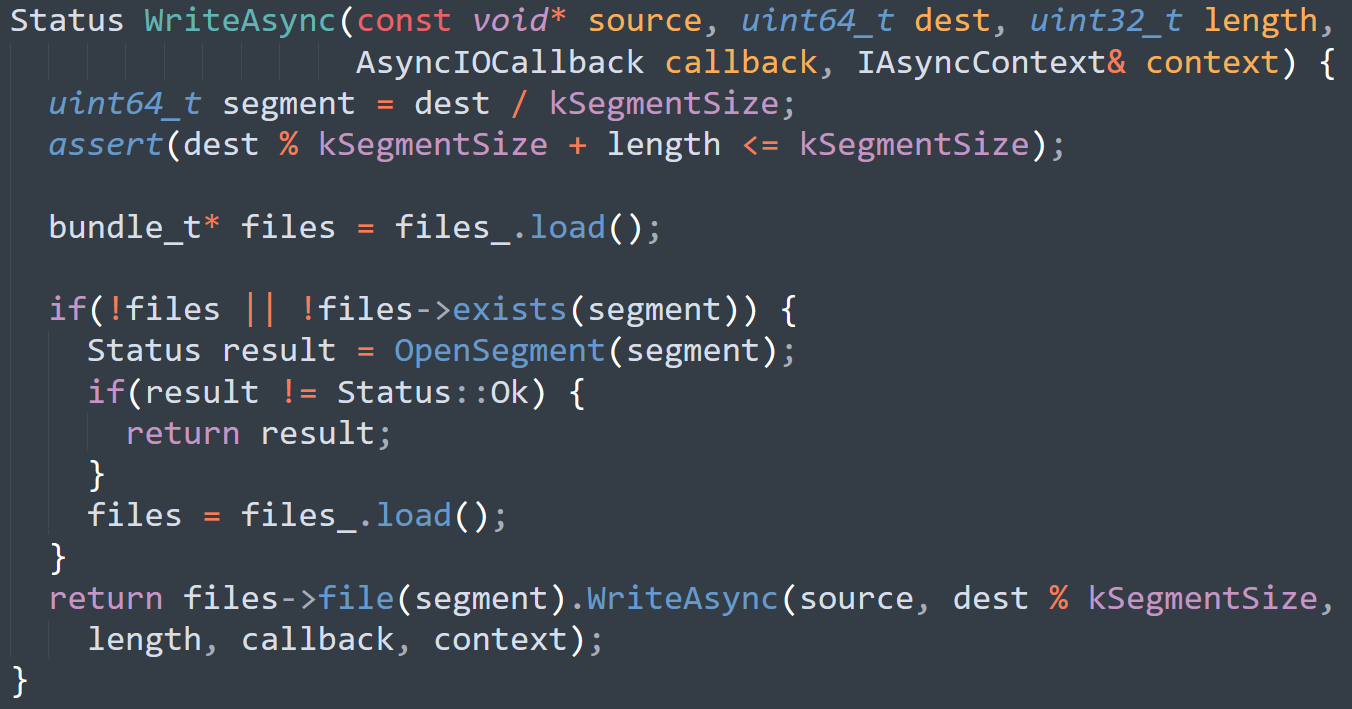
This means that the earlier definition of FasterKv basically defined Segment Size of 1 GB in size. I’m not sure what these segments are, though. I’m pretty sure that this is how they manage time base expiration, but I’m not certain. Following upward from the creation of a new segment, we have WriteAsync, like so:

image

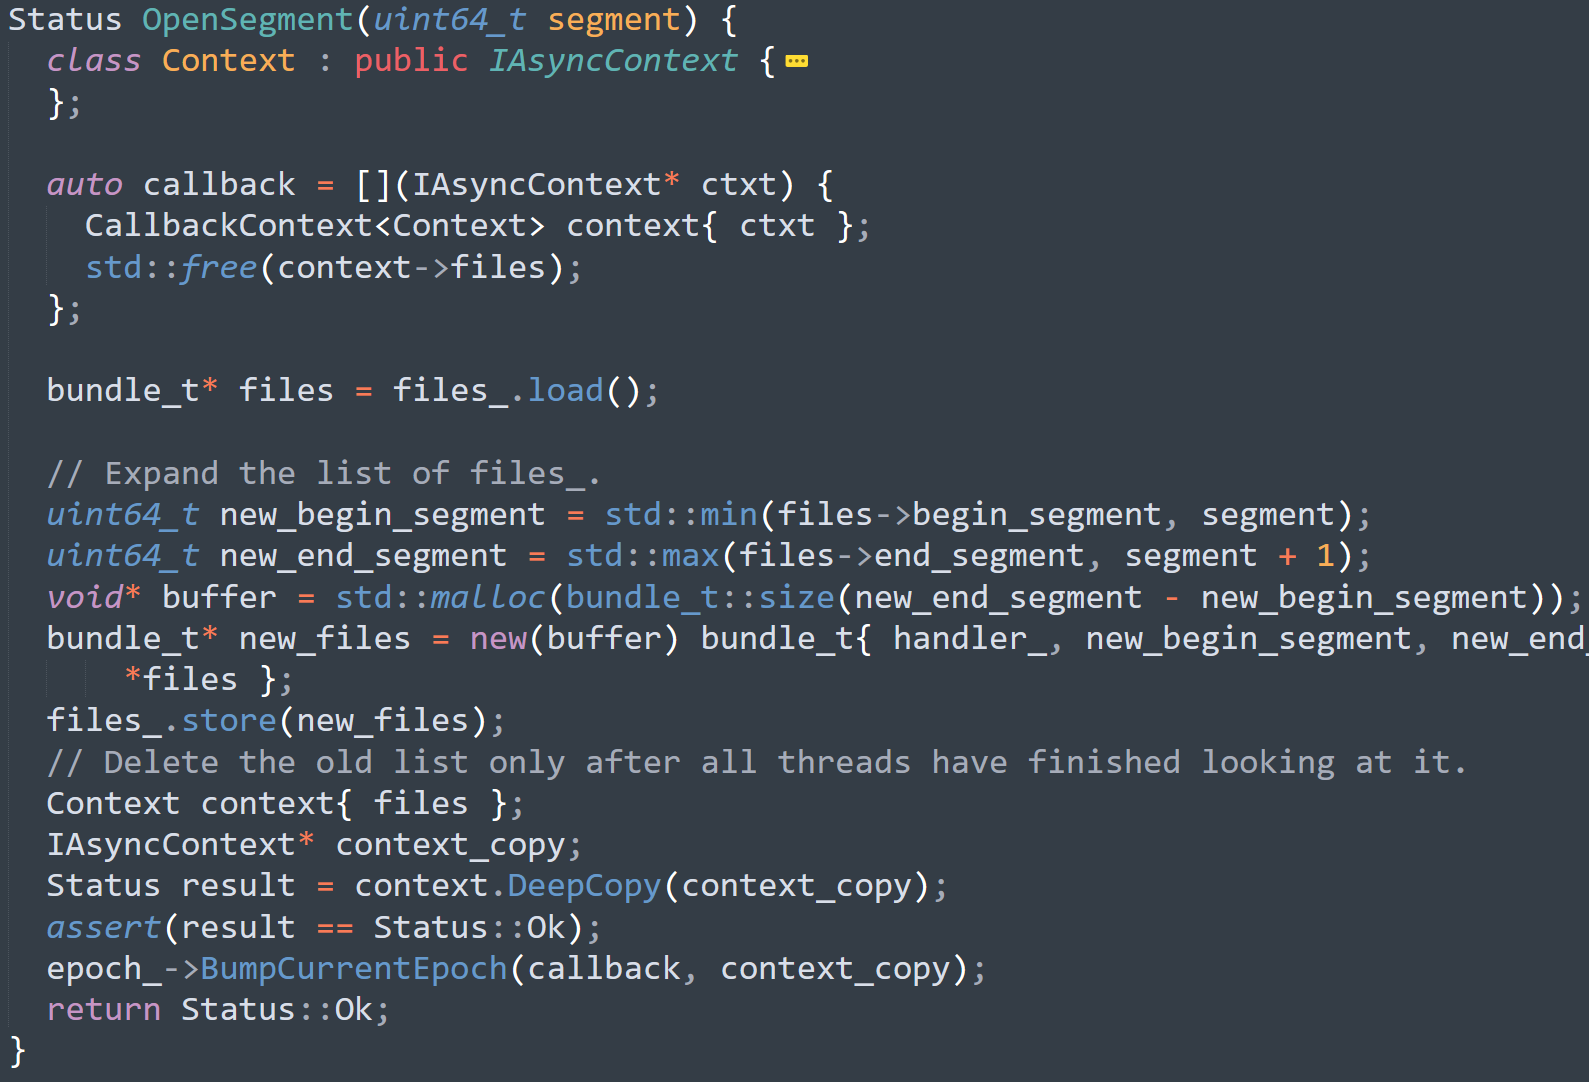
You can see that the segment number is basically just the file id, and if the file does not already exists, we call OpenSegment on it. Afterward, we call WriteAsync on that specific file. I’ll look into how that work in a bit, this isn’t that interesting at the moment. Right now I want to dig into OpenSegment. I removed some error handling here, but the gist of it is clear.

image

The actual code also handles threading and errors, which I omitted. You can see that it creates the new files, copying them from the existing value. Then it creates a context that holds the old files and pass it to BumpCurrentEpoch.

When FASTER is sure that no one else is looking at this epoch, it will call the callback and delete / dispose the old files. This is a nice way to ensure consistency. LMDB does something similar with its transactions’ table. So now we know that whenever we write at a 1GB boundary, FASTER will generate a new epoch.

What about the actual writing? Here is what this looks like (the Linux impl):

image

On Linux, this ends up being:

image

This is then checked in TryComplete:

image

This is called FasterKv.CompletePending(), which seems to be called occasionally by FASTER. On Windows, this is using async I/O and callbacks to handle this.

Okay, this is already long enough, but I got a handle on how FASTER is writing to disk, even though I don’t know yet what it is doing with that. I also saw an actual use of Epoch that made sense (clearing old data once no one is looking at that).

time to read 6 min | 1147 words

After going over the paper and the managed implementation, I’m ready to start with the C++ implementation. I have higher hopes for this code. As I started browsing the C++ code, it occurred to me that the way the C#’s implementation handles dynamic code generation is pretty much how templates in C++ work. I wonder if this was the trigger for that.

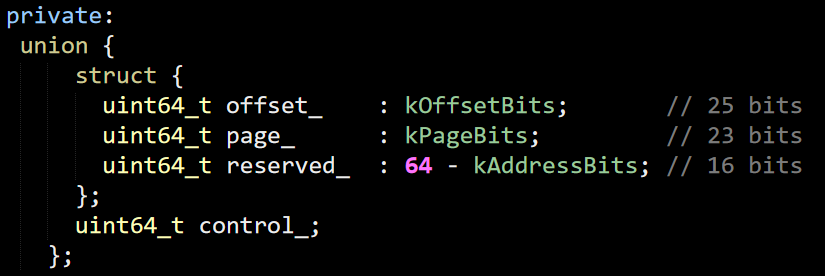
The C++ code reads a lot more naturally to me. There are some nice tricks that are used there that are a joy to read. For example, take a look at Address manipulation:

image

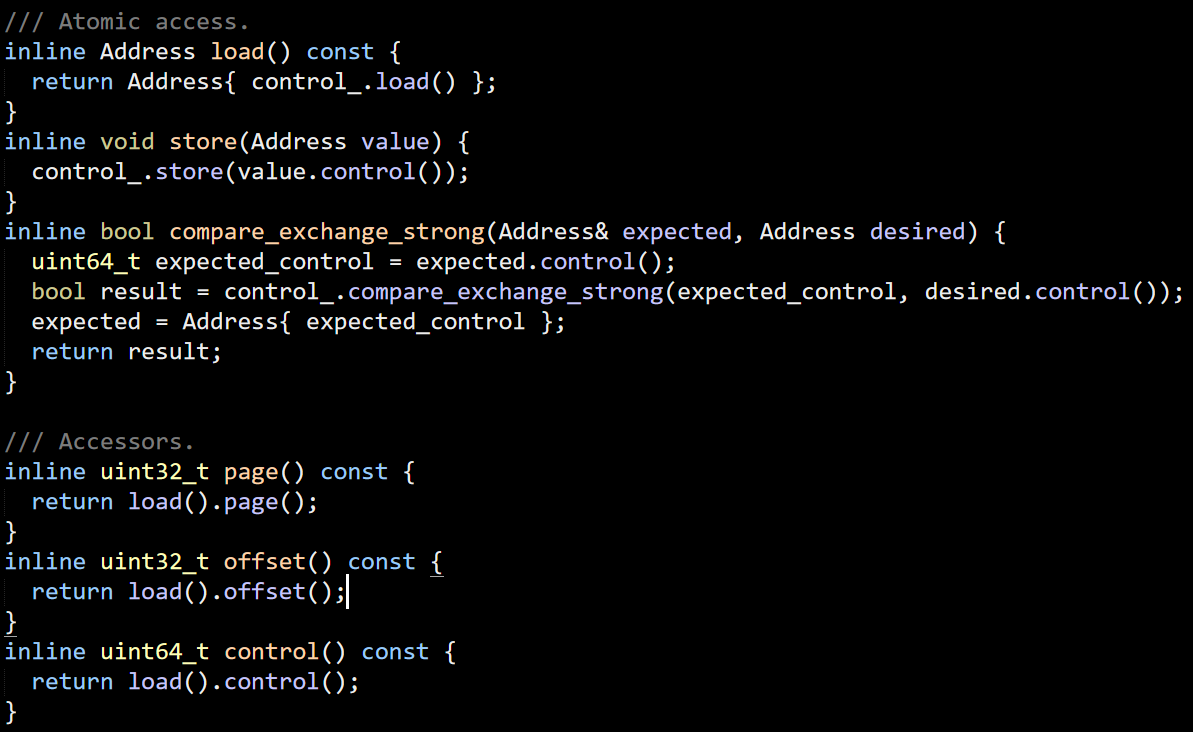
The colon syntax are a way to express bitfields in C. But the real fun part for me is the idea of control_. What is this for? Well, it runs out that in addition to Address, the also defined AtomicAddress, whose implementation need to provide atomic operation on address. This is implemented in the following manner:

image

I find this a really elegant way to handle this requirement.

Another amusing observation is that almost all the code in FASTER is in .h files, because of the heavy use of templates. I wonder how that affects compilation speed and how that would play in larger projects.

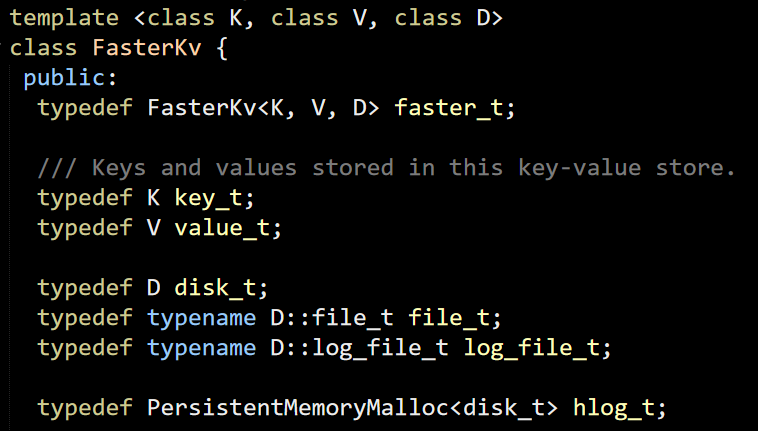
It is in faster.h that we start to get into the interesting bits. I first run into this guy:

image

This maps pretty closely to what I have actually seen the C# code does, but in C++ it is a much more natural approach that dynamic compilation on the fly as it did in C#.

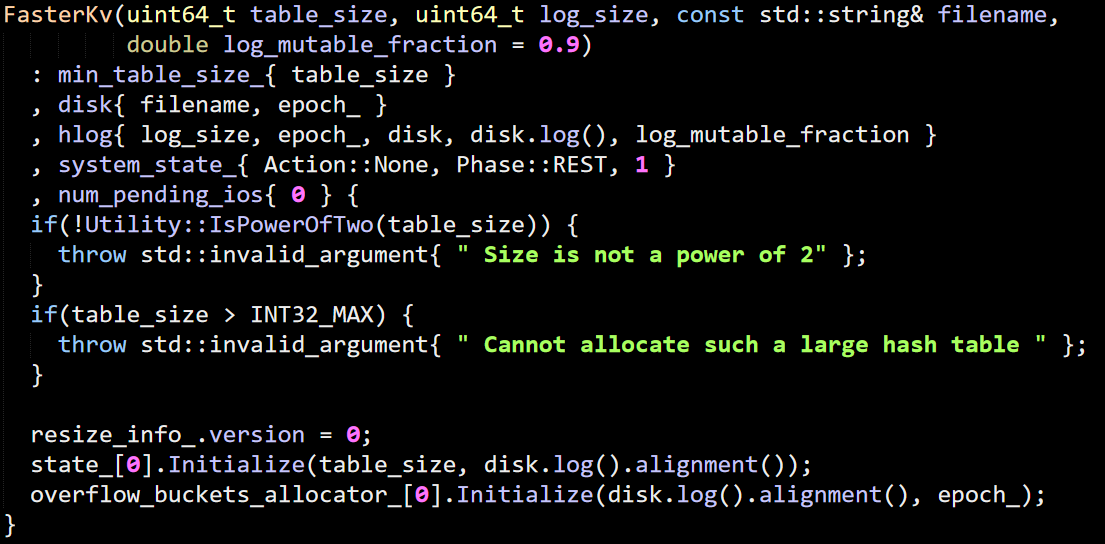
Next we have the constructor, which looks like this:

image

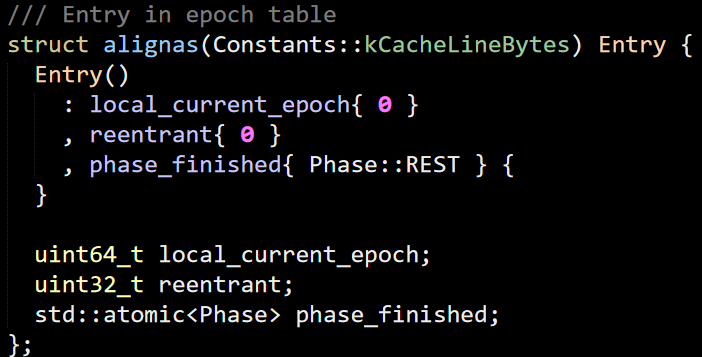
The epoch_ field is auto initialized by the compiler and is not shown here. This indicates that FASTER can handle up to 2.1 billion entries in total, which seems to be a strange limit for a data store that is expected to handle hundreds of thousands of operations per second. I’m going to jump around the codebase a bit, because I want to follow exactly what is going on when initializing this class. The first place to look is the epoch. The idea of epoch is described in the paper, so I’m not going to repeat it. The code defines a struct that is 64 bytes in size (cache line sized, to avoid false sharing), this is used to store a thread specific value and is used to maintain most of the invariants of the epoch.

image

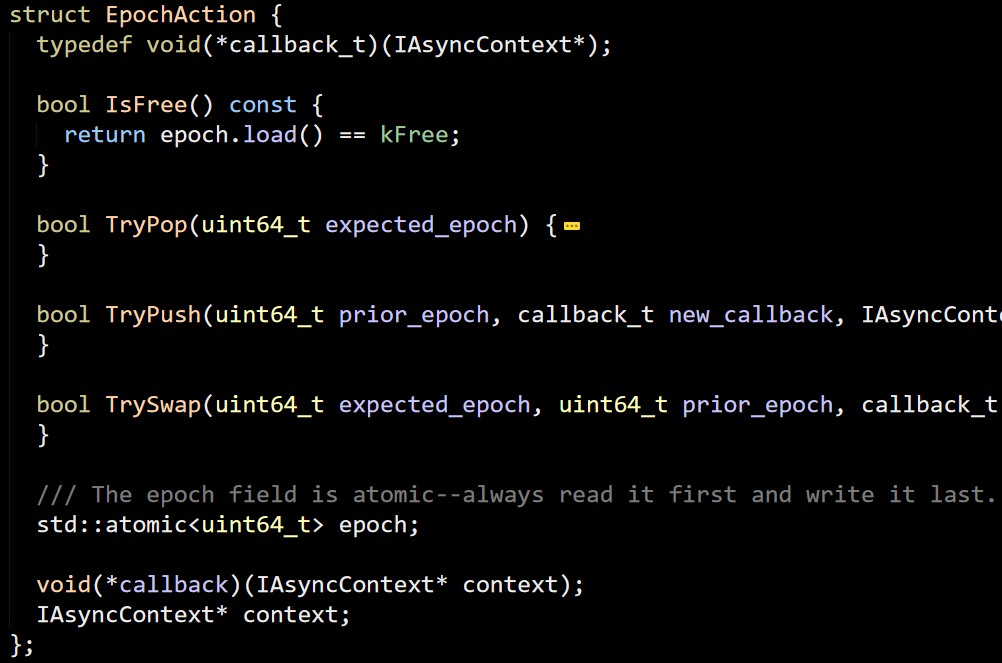
When switching between epochs, there are actions that needs to be run, here is what this looks like in the code.

image

I must say, this really mess up with my mind, because we have C#’s naming conventions (TryPop, TryPush) in C++ code. It’s like the code couldn’t decide what shape it wanted to be in either language.

The number of threads that can take part is limited by this value:

image

Right now, this is set to 96, which means that if you need more threads than that, you’ll get a runtime error. This fits nicely with the model FASTER uses of long running threads, but I don’t see how it can play well with actually accepting commands from network / other location.

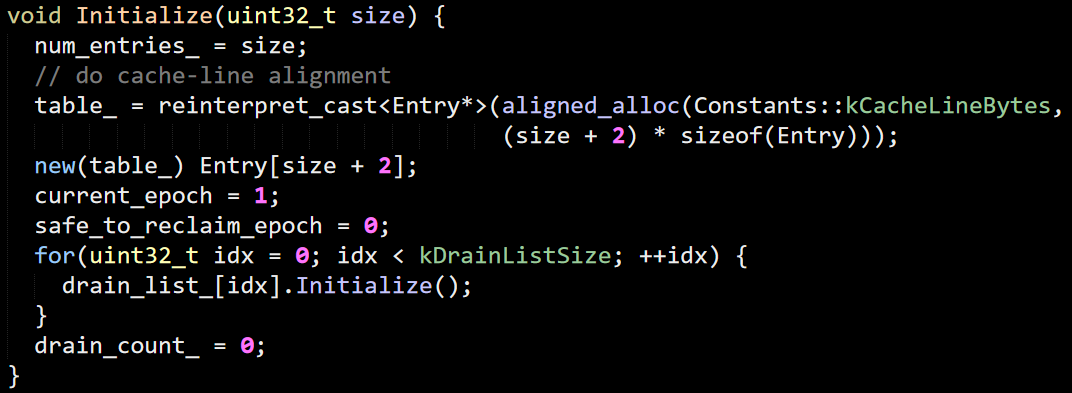
As part of it’s constructor, this method is called, which actually does the real work of setting up the epoch.

image

I’m not really sure at this point why it is allocating two additional entries beyond the specified size.

When a thread start running FATER code, it needs to register itself with the Epoch, this is done in the Protect() call.

image

Going into the Thread class reveals a simple table of values that are used to give ids to the threads that asked to get an id. This is done in this function:

image

It took me a couple of times of reading the first two lines to understand what is going on here. This is an awesome way to handle a circular buffer scanning. It is very clear and saves a bunch of code ( at the cost of doing mod operation, which can be usually be masked if the value is known at compile time and is a power of 2, which in this case it is not). I’m probably going to use this the next time I need to implement scanning through a ring buffer.

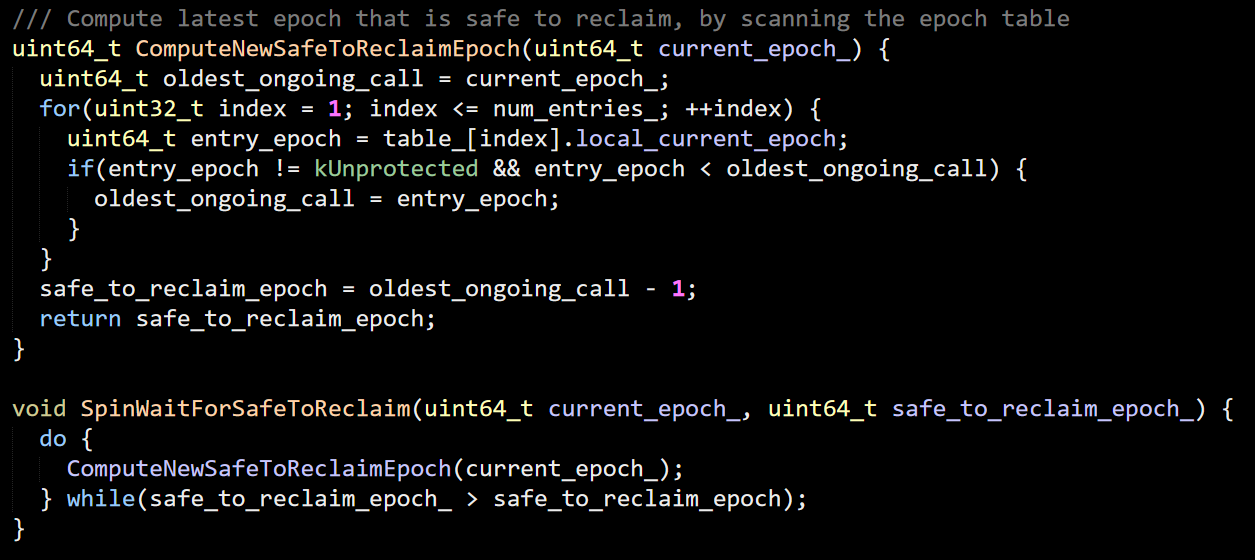
Then we have computing the earliest safe epoch:

image

The first of these methods is elegant, it does a simple read from the table, reading potentially stale values. This doesn’t matter, because the worst thing that can happen is that we’ll keep a previous epoch for longer than it is required.

The second one reads wrong to me, but I’ll have to dig deeper into the C++ memory model more deeply for this. The problem is that this seems like it is relying on the CPU to update its state somehow. But I don’t see any instruction that would force it to. I think that the set to safe_to_reclaim_epoch (which is std::atomic<uint64_t>) will use memory_order_seq_cst for the operation, but I’m not sure how that would impact reads from the table_.

Also, I want you to pay attention to the variable names here. Private member fields:

image

Public member fields:

image

And then we have SpinWaitForSafeToReclaim that uses:

  • safe_to_reclaim_epoch – public member field
  • safe_to_reclaim_epoch_ – method argument

I’m not sure if this a common practice in C++, but this is really confusing to me. This is enough for now, I’m going to keep going thought the C++ code in my next post. There hasn’t been anything really interesting so far, just digging into the code and getting a feel as to how it is put together.

time to read 3 min | 595 words

Before heading to the C++ implementation, I thought I would take the time to just walk through the FASTER codebase as it is performing a simple operation. The access violation error that I previously run into has been fixed, so I could run the benchmark. Here is my configuration:

image

I got the following results, when running on a single thread.

Total 142,603,719 ops done  in 30 secs.

This is about 4.7 million operations per second, which is certainly nice. I then decided to compare this to ConcurrentDictionary to see what kind of performance that would give me. I made the following changes, which I’ll admit are pretty brute force way to go about it. But note that this is probably significantly less efficient then I could probably write it. Nevertheless, using ConcurrentDictionary with a single thread in the same benchmark gives me:

Total 84,729,062 ops done  in 30 secs.

There isn’t much call for using this on a single thread, though. My machine has 20 cores, so let’s see what happens when I give FASTER its head, shall we?

2,330,054,219 ops done  in 30.021 secs.

That is impressive, with about 77,668,473 operations per second. On the other hand, this is what happened when I run with 20 threads and ConcurrentDictionary:

671,071,685 ops done  in 30.024 secs.

This gives us “only” 22,369,056 operations per second.

It is clear that FASTER is much better, right? The problem is that it isn’t much faster enough. What do I mean by this? I used idiomatic C# for the ConcurrentDictionary usage and got with 1/4 of FASTER’s perf. The FATER codebase is doing native calls and unsafe manipulation, dedicated allocation, etc. I expect to get better perf at that point, but “merely” 400% improvement isn’t enough for the kind of effort that was put into this. I run the concurrent dictionary in a sampling profiler, with 20 threads, and I got the following results.

image

On the other hand, using FASTER for the same scenario gives:

image

This is really interesting. You can see that the FASTER option spends all its time in either: InternalUpsert or inside the RunYcsb method (which is actually the store.Read() method that was inlined).
What is more interesting is that there are no additional calls there. The InternalUpsert call is 219 lines of code, and the code uses [MethodImpl(MethodImplOptions.AggressiveInlining)] quite aggressively (pun intended). On the other hand, the ConcurrentDictionary implementation has to make virtual method calls on each call.
There are several ways to handle this, including using generic struct that can eliminate most of the virtual calls. This is effectively what FASTER is doing, without the generics. FASTER also benefits from pre-allocating everything upfront. If you’ll look at the profiler results, you can see that these are the major source of “slowness” in the benchmark.

Given the nature of the benchmark, I feel that it is unfair to compare FASTER to persistent data stores and it should be compared more closely to a concurrent hash map. Given that this is effectively what FASTER is doing in this showcase benchmark, that seems a lot more fair. I checked the literature and we have this paper talking about concurrent hash maps where we see (Figure 2.a) numbers that near to 300 millions ops/sec for pure writes and 600 millions ops/sec for reads.

time to read 7 min | 1295 words

Last post commented on the FASTER paper, now I’m getting to reading the code. This is a pleasant change of scenery for me, since FASTER is written in C# (there is a C++ port that I’ll also be going through later). As someone who spend most of their time in C#, that make it much easier to go through the code. On the other hand, this was clearly written by someone who spent most of their time in C++. This means that naming conventions and the general approach to writing the code sometimes directly contradict C# conventions. Some of that really bugs me.

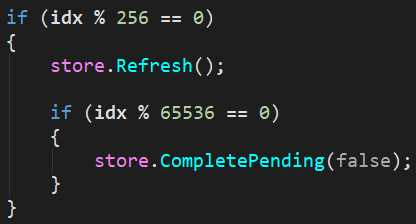
The first thing I did was to try to run the benchmark on my own machine, to get relative numbers. It died with an AccessViolationException, which was a disappointment. I’m going to ignore that and just read through the code. One thing that I did noticed when reading through the benchmark code is that this piece:

image

This maps closely to some of the things they mentioned in the paper, where each thread refresh every 256 ops and complete pending operations every 65536 ops. The reason I call this out is that having this done in what effectively is a client code is a bad idea in term of design. The benchmark code is operating under continuous stream of operations and can afford to amortize such things. However, real code need to deal with client code that isn’t well behaving and you can’t assume that you’ll be operating in this kind of environment.

Based on the semantics discussed in the paper and what the code is showing me, I would assume that the general model for actually using this is to spawn off a bunch of threads and then listen to some data source. For example, a socket. On each network read, the thread would apply a batch of operations. Note that this means that you have to deal with threads that may be arbitrarily delayed. I would expect that under such a scenario, you’ll see a very different performance profile. You won’t have all threads working in tandem and staying close to one another.

When getting to the code itself, I started with the native portions, trying to figure out what FASTER is doing with the lowest level of the system. It is mostly advanced file operations (things like telling the OS to don’t defrag files, allow to allocate disk space without zeroing it first, etc). As far as I can see, this isn’t actually being called from the current code, but I assume that they at least tested out this approach. Another native code they have is related to calling __rdtsc(), which they use in the HiResTimer class.

This can be replaced completely by the .NET Stopwatch class and I believe that dropping the adv-file-ops and readtsc native projects is possible and straightforward, allowing for a fully managed FASTER impl. Note that it is still using a lot of interop calls, it seems, but at least so far, I think that most of them are not necessary. To be fair, given the way the code is structured, a lot of the native code is about I/O with pointers, which until the Great Spanification in .NET Core was PITA to deal with.

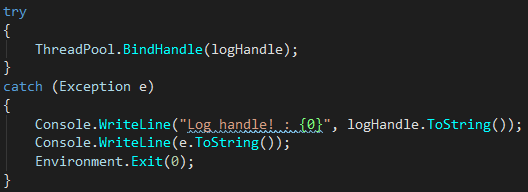
In general, by the way, the code reads more as a proof of concept than a production codebase. I notice this in particular with the general approach for errors handling. Here are two examples:

image

This is from the native code, from which it is a PITA to return errors. However, writing to the console from a library is not an error reporting strategy. What really bugged me was this code, from the MallocFixedPageSize code:

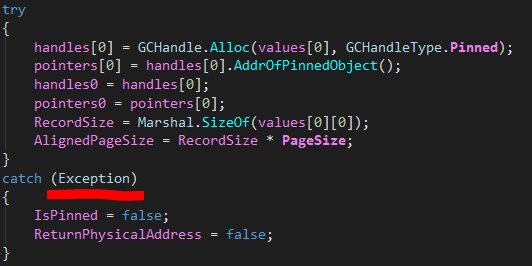
image

If there is any error in the process of pinning memory, just ignore it? Leave the memory pinned?

Here is another example that made me cringe:

image

Moving on to the CodeGen directory, it gets interesting. The paper talks about dynamic code generation, but I didn’t expect to see such wide usage of this. In particular, large sections of the code (13 files, to be exact, over 6000 lines of code) are dynamically loaded, transformed and compiled on the fly when you create the hashtable.

I understand the reasoning for this, you want to get the JIT to compile the best possible code that it can for the specific operations you execute. However, this make it pretty hard to follow what is going on there. In particular, code generating code make it harder to follow what end up actually going on. There are also better ways to do it. Either through generic struct parameters to specialize the code or only generating the dedicated connecting methods as needed and not recompiling large portions on the fly.

The Device directory isn’t really interesting. Mostly pretty trivial I/O operations, so I’m not going to discuss it in depth.

Next, getting to the Epoch, which was really interesting to read in the paper. The actual implementation raise a few questions. The Epoch value in an 32 bits integer, that means that it will wrap fairly quickly. It looks like the Epoch is bumped every time you need a new page. Given the operations rate that are reported, I would expect it to happen on a regular basis (this is also required for the system to progress properly and sync up). My reading is that wrapping of the Epoch counter will result in Bad Things Going On.

There there is this:

image

Size, in this case, is always set to 128. The size of Entry is 64 bytes, this means that this call will allocate 8,320 bytes in Gen0, immediately pin it and never let it go. This is going to result in memory fragmentation. It would be better to allocate this on the Large Object Heap and avoid the issue. In fact, the same issue can be seen in the memory allocation, where the code does:

image

In This case, PageSize is 65,536, however, and given any value except a byte, this will automatically go to the Large Object Heap anyway. I’m going to be a bit ungenerous here, but I’m not sure if this was intentional or not.

I’m firmly convinced that this is pure POC code, here is the snippet that finally did it for me, from the BumpCurrentEpoch() code.

image

Note that I don’t mind the Thread.Sleep() here, it make sense in context, but the Console.WriteLine cinched the deal for me. This is not something that you can take a use, but something to look at as you implement this properly.

I have to say that I find it very hard to go through the code, mostly because it’s in C# and there are certain expectations that I have from the code which are routinely violated. I think that I’m going to stop reading the C# codebase and switch over to the C++ implementation. I expect this to be more idiomatic, both because it is the second time this was written and because the people writing the code are clearly more using to writing in C++.

time to read 5 min | 822 words

imageThe FASTER is a fast key-value store from Microsoft. It’s paper was published a while ago and now that the source is available, I thought that I would take a peek. You might say that I have a professional interest in such a project Smile.

I decided to read the paper first before reading the code, because I want to figure out what isn’t in the paper. The implementation details beyond the abstract are what I find most interesting, to be honest. But if I’m going to read the paper, I’m also going to add some comments on it. Please note that the comments are probably not going to make much sense unless you read the paper.

The Epoch Basic section explains how they use a global epoch counter with a thread local value and a shared table that marks what epochs are visible to each thread. They use this to provide synchronization points, I assume (don’t know yet). This resonates very strongly with how LMDB’s global transaction table operates.

I like the concept of the drain list which is executed whenever an epoch become safe. I would assume that they use that to let the clients know that their operation was accepted and what was its state.

I wasn’t able to figure out what they use the tag for in the hash bucket entry. I think that the way it works is that you have K hash buckets and then use the first K bits to find the appropriate bucket, then scan for a match on the last 15 bits. I’m not really sure how that work with collisions, though. I assume that this will be clearer when I get to the code. I like the two phase scan approach to ensure that you have no conflicts when updating an entry.

The paper keeps repeating the speed numbers of 160 millions ops/sec and talking about 20 millions ops / sec as being “merely”. Just based on my reading so far, I don’t see how this can happen. What is interesting to me is what is the definition of ops. Is it something like incrementing the same (small) set of counters? If that is the case, than the perf numbers both make more sense and are of less interest. Typically when talking about ops / sec in such scenarios we talk about inserts / updates to individual documents / rows / objects. Again, I don’t know yet, but that is my thinking so far.

One thing that I find sad is that this isn’t a durable store. A failure in the middle of operations would cause some data to be completely lost. It seems like they have support for checkpoints, so you don’t lose everything. However, I’m not sure how often that happens and the benchmarks they are talking about were run without it. Interestingly enough, the benchmarks were run without garbage collection. I haven’t gotten to the discussion on that yet, so I’m not exactly what that means Another missing feature here is that there is no support for atomicity. You cannot ensure that two separate operations will run as a single atomic step.

The benchmark machine is 28 cores with 256GB RAM and 3.2 TB NVMe drive. This is a really nice machine, but from the get go I can tell that this is not going to be a fair comparison to  most other storage engines. Faster is explicitly designed to work mostly in memory and with high degree of parallelism. This is great, but it gives us some important features (atomic batches and durability, also known as transactions). The data size they tested are:

  • 250 million records with 8 bytes keys & 8 bytes values – Just under 4GB in total.
  • 250 million records with 8 bytes keys & 100 bytes values – Just under 32GB in total.

I’m not sure why they think that this is going to provide larger than memory setup. In particular, they mention a memory budget of 2GB, but I assume that this is just internal configuration. There is also going to be quite a lot of memory cached in the OS’ page cache, for example, and I don’t see anything controlling that. Maybe I’ll when I’ll go through the code, though.

Okay, the garbage collection they refer to is related to how they compact the log. They use an interesting approach where they just discard it at a some point, and any pointer to the removed section is considered to be deleted automatically. That is likely to be very efficient, assuming that you don’t care about older data.

All in all, I feel that I have a vague understanding on how Faster works and a lot better grasp on what it does and how it is utilized. I’m looking forward to diving into the code.

time to read 2 min | 255 words

imageJust asked a candidate to do a task that requires an O(1) retrieval semantics.  Off the top of his head, he answered that he would us a Trie.  That is an exciting new development in phone interviews, since this data structure doesn’t come up all too often.

I asked him to explain why he didn’t chose a dictionary as the underlying data structure. His answer was… illuminating.

He explained (in detail, and correctly) how hash maps work, that they rely on probability to ensure their O(1) guarantees and that he didn’t feel that he could select such a data structure for O(1) performance before analyzing the distribution of the data and figuring out if there are too many expected collisions in the data set.

All pretty much text book correct. In fact, if one is writing their own hash map (don’t do that) that is a concern you need to take into account. But in the real world, this is usually a solved problem. There are certain malicious inputs that can get you into trouble and there are certain things you need to take into account if you are writing your own hash function. But for the vast majority of cases and scenarios, you don’t need to worry about this at all.

The candidate is a student in the last stages of his degree and it shows. He gave a wonderful answer, if this was a test. It was just so wonderfully wrong.

time to read 6 min | 1154 words

I run across this Twitter thread and I’m in… awe, I want to say, but in a really horrifying manner.

The thread started with DHH calling out this job posting:

image

I’ve marked the important piece. You can read the twitter thread for the gory details. Based on the job posting and the interaction of the CEO on twitter, I’m going to assume that this job pay six to nine times more than the average developer can make, because otherwise I can’t really figure out why anyone would work in such a place.

I have had two (or three) separate burnouts before I was thirty. I was single, no kids, and I worked crazy hours. I was productive and I burned out. Mid 2009 was a fun time for me, I was physically nauseous every time I sat in front of a computer  and seriously considered a career shift to construction. A large number of life decisions were made as a result of that.

And while I admit that being young and discovering things is its own reward, this isn’t really something new. Workplace productivity is not an unexplored subject and I would expect anyone in either HR or management position (and certainly a CEO in a company that is busy hiring people) to be at least peripherally aware of them.  You might sometime need to work crazy hours, I fully understand crunch time and “OMG, production is DOWN”. But if you do that, you need to understand that this is done with eyes open.  Such scenarios should be rare and you should be aware that any temporary increase in productivity will need to be paid off by reduced productivity down the line.

Again, this isn’t new. You can go to Ford in the early years on the last century to read more about how to increase productivity. So asking for 60 hours per week on an ongoing basis is pretty… crazy.

Let’s assume that this is for five days a week position, shall we? Based on the job posting on the CEO’s behavior on Twitter, I assume that it isn’t the case, but humor me.

This means, Monday to Friday, you start working at 9 AM and finish at 9 PM. If you have kids, this means never reading them a bed time story, not being able to see them perform, never coming to PTA meeting. If you have a spouse, it means a relationship that is mostly around texts, because you ain’t going to see them.  If you don’t have a significant other, good luck finding one with the time allotted.  But 12 hours days are probably not going to cut it. So let’s say that you work only 10 hours a day, but we’ll include Sunday as well, to make up for the “lost time”. You still log in at 9AM, but now you get to leave at 7 PM.

Oh, and if you better not be sick, or have to drive your mom to the airport or need to visit the DMV. Nobody got any time for that. On a more serious note. This kind of environment will make you sick. It can take a lot of time to recover from that, both mentally and physically.

I can’t imagine anyone who would be signing up for something like that. Actually, I can, quite easily. There are plenty of professions where this is normal. To pick examples off the top of my head, lawyers, nurses and doctors all work crazy hours, or at least, that is the impression I have. Let’s check, shall we? The following results are pretty much the first result of googling the question.

  • Lawyers, for example, can expect to work 60+ hours a week on average.
  • Nurses, on the other hand, are considered full time if they work about 36 – 40 hours a week.
  • Doctors, vary wildly, with 40 - 80 hours, depending on the type of specialty and where they are in their career.

The key here, for both lawyers and doctors, is that typically after a pretty harsh initial period, you can expect to gain a lot for your work. In other words, there is a high probability that there is going to be a good return on this investment.  For this job posting, again based solely on the text and the CEO’s behavior, I’m assuming there is no such upside.

Whenever we sent job acceptance letter, I used to put in a statement about Hibernating Rhinos being a place where you didn’t have to leave the office at 9 PM. Since then we grew a bit and got a few people who are a night owls, so they come later to the office. That somewhat spoils this statement, but I can still state that no one works crazy hours.

By the way, that is not because some of the devs haven’t tried. I’m very familiar with the excitement of being almost there. At the cusp of figuring out this bug or completing that feature. It sometimes make sense to keep going and complete just this one task and getting there. And this is fine, if you pace yourself. But with some people, I had to tell them that if they keep staying so much in the office, I’m going to start charging them rent. That seemed to do the trick.

When I founded Hibernating Rhinos, I wanted to create a place that I would like which would give me interesting things to work on . In the decade that Hibernating Rhinos has been around, I don’t believe that we ever had a crunch time that didn’t directly relate to a customer problem (and these tend to be rare) . Whenever I had to make the choice, slipping the release date has always been the better option in my eyes rather than sacrificing quality or keeping people at their desk to try to get more done.

This includes the last three years in which our team basically rebuilt a distributed database from the ground up and gotten a minimum of 10x performance improvement across the board. This was without anyone expected to put in sunrise to sundown shifts. Given that I think that this is about creating a marketing/sales platform. I’m… not impressed by that. In fact, I’m pretty sure that if they start out with planning to squeeze their own people dry from the get go they have the same level of cluelessness in other aspects of the business. On the other hand, assuming that they actually manage to get a viable product out, someone is going to have a field day threading through all the holes that tired, listless and demotivated developers have left in the system.

I think that I can summarize all of this post in a single word: BEWARE!

time to read 2 min | 345 words

After we built the SQL Migration Wizard for RavenDB 4.1, we started to field questions about assistance in migrating from more databases. As a result of this, we have introduced a support for MongoDB and CosmosDB migration.

I’m going to walk you through how this works. First, you’ll need to download the Release Candidate of RavenDB 4.1. In addition to the zip package, you’ll need to download the Tools zip file as well.

Next, run RavenDB and create a new database, then go to Settings > Import Data and select From other. Here is what this will look like:

image

I went to shodan.io and found a publicly available MongoDB server to test this out. The process completed successfully and gave me a single document:

image

I guess someone already got to this instance.

More seriously, I scanned literally the first page in this listing and was able to connect and retrieve real documents from a few of them. That included what looked like users (hashed) passwords, among other details. I deleted the data

At any rate, you can use this wizard to pull data from a MongoDB instance to your RavenDB database. RavenDB will handle all the details of the transfer for you. There is even the option to use a transformation script to shape the data as it goes into RavenDB.

You can do the same for CosmosDB, as you can see below:

image

These credentials I got from doing a GitHub search.

On the one hand, I’m really happy that the feature works. On the other hand, I’m pretty much in a state of despair from the state of security in general.

We are looking into other databases that our users want to migrate from. If you have such a need, please let us know.

time to read 1 min | 128 words

Last Friday, without much of a fanfare, we released the Release Candidate of RavenDB 4.1. This release concludes about six months of work to bring some new and awesome features to the table:

  1. Cluster wide transactions
  2. JavaScript indexes
  3. SQL Migration Wizard
  4. Distributed Counters
  5. RavenDB Embedded (for .Net, Python, etc)
  6. MongoDB & CosmosDB migration
  7. Results highlighting
  8. Subscription includes
  9. Explain query plan
  10. Explain query execution
  11. Query timing
  12. Better setup wizard and reducing deployment friction

And these are just the first dozen big features. We made a lot of improvements, supporting wild card certificate generation in the setup process, better spatial units support and a plenty of other stuff that isn’t sexy or attractive on its own but adds up to a major jump in what you can do with RavenDB.

time to read 6 min | 1136 words

When I designed RavenDB, I had a very particular use case at the forefront of my mind. That scenario was a business application talking to a database, usually as a web application.

These kind of applications have a particular style of communication with the user. As you can see below, there are two very distinct operations. Show the user the data, followed by some “think time” (seconds at minimum, but can be much longer) and then followed by an action.

image

This shouldn’t really be a surprised for anyone who developed any kind of application for the last decade or two, so why do I mention this explicitly?  I mention this because of the nature of communication between the application and the database.

Some databases have a the conversation pattern with the application. In terms of API, this will look something like this:

  • BeginTransaction()
  • Update()
  • Insert()
  • Commit()

This is a very natural model and should be quite familiar for most developers. The other alternative to this method is to use batches:

  • SaveChanges( [Update, Insert] )

I want to use this post to talk about the difference between the two styles and how that impacts your work. Relational databases uses the conversation style while RavenDB uses batch style. On the surface, it looks like it would be a more complex to use RavenDB to achieve the same task, but there is very little difference in the API as far as the user is concerned. In both cases, the code looks very much the same:

Behind the scenes, however, the RavenDB code will send just a single request to the server, while a relational database will need four separate commands to execute the transaction. In many cases, you can send all of these commands to the server in a single roundtrips, but that is an optimization that doesn’t always work and often isn’t applied even when it is possible.

Sidebar: Reducing server roundtrips

Why is the reduction in server roundtrips so important? Because it has a lot of implications on the overall performance of the system. In many cases the cost of making a remote query from the application to the database far outstrips the costs of actually executing the query. This ties closely to the Fallacies of Distributed Computing. Latency isn’t zero, even though when you develop locally it certainly seems like this is the case.

The primary goal of this design in RavenDB was to reduce the number of network roundtrips that your application must endure. Because in the vast majority of the cases, your application is going to follow the “show data” / “modify data” as two separate operations (often separated by a long idle time) there is a lot of value in having the database interaction model match what you will actually be doing.

As it turned out, there are some additional advantages (and disadvantages, which I’ll cover a bit later) to this approach, beyond just the obvious reduction in the number of server roundtrips.

When the server gets all the operations that needs to be done in a single request, it can apply all of them at once. For that matter, it can chose how to apply them in the most optimal order. This gives the database server a lot more chances for optimization. It is similar to going to the supermarket with a list of items to purchase vs. a treasure hunt. When you have the full list, you can decide to pick things up based on how close they are on the shelves. If you only get the next instruction after you complete the previous one, you have no option for optimization.

When using the conversation style, durability and state management become more complex as well. Relational databases typically use some variation of ARIES for their journals. This is because they need to record information about ongoing transactions that haven’t yet been committed. This add significant complexity to the amount of work that is required from the database engine. Furthermore, when running in a distributed system, you need to share this transaction state (which hasn’t yet been committed!) across the nodes to allow failover of the transaction if the server fails. With the conversation style, you need to support concurrent transactions all operating at the same time and potentially reading and modifying the same data. This lead to a great deal of code that is required to properly manage locking and latching inside the database engine.

On the other hand, batch mode give the server all the operations in the transaction in a single go. This means that failover can simply be sending the batch of operations to another node, without the need to share complex state between them. It means that the database server has all the required information and can make decisions based on it. For example, if there are no data dependencies, it can execute the operations in the transaction in whatever order it desires, leading to more optimal execution time. The database can also mix & match operations from different transactions into a single batch (as long as it keeps the externally visible behavior consistent, of course) to optimize things even further.

There are two major disadvantages for batch mode. The first of which is that there is usually a strict separation of reads from writes. That means that you usually can’t get a single consistent read/modify operation that stay in the same transaction. The second issue is similar, because you need to generate all the operations ahead of time, you can’t make decisions about what operations to execute based on the data you read, at least not in the same transaction. The typical solution for that is to send a script in the batch. This script can then read / modify data in the same context, apply logic, etc. The important thing here is that this script runs inside the server, already inside the transaction. This means that you don’t pay network round trips time to make such operations.

On the other hand, it means that you need to write potentially complex logic in the database’s scripting language, rather than your own platform, which you’ll likely prefer.

Luckily, for most scenarios, especially with web applications, you don’t need to execute complex logics on the server side. You can usually just send the commands you need in a single batch and be done with it. Often, just have optimistic concurrency is enough to get you the consistency you want, with scripting reserved for more exceptional cases.

RavenDB’s usage scenario was meant to make the common operations easy and the hard stuff possible. I think that we got it right and ended up with an API that is functional, highly performant and one that has withstood the test of time very well.

FUTURE POSTS

No future posts left, oh my!

RECENT SERIES

  1. Challenge (75):
    01 Jul 2024 - Efficient snapshotable state
  2. Recording (14):
    19 Jun 2024 - Building a Database Engine in C# & .NET
  3. re (33):
    28 May 2024 - Secure Drop protocol
  4. Meta Blog (2):
    23 Jan 2024 - I'm a JS Developer now
  5. Production Postmortem (51):
    12 Dec 2023 - The Spawn of Denial of Service
View all series

RECENT COMMENTS

Syndication

Main feed Feed Stats
Comments feed   Comments Feed Stats
}