Oren Eini

CEO of RavenDB

a NoSQL Open Source Document Database

Get in touch with me:

oren@ravendb.net +972 52-548-6969

Posts: 7,520
|
Comments: 51,141
Privacy Policy · Terms
filter by tags archive
time to read 6 min | 1086 words

I love trees. Not the ones that produce oxygen, I mean, I guess they are nice too, but I’m talking about trees in software. To be rather more exact, I’m fascinated by B+Trees and all their permutations. In a very real sense, most databases are all about B+Trees. To give you some context, Voron alone, at this time, has the following:

  • Tree – the core used to map an arbitrary byte string key to an arbitrary sized value. This supports many operations, including compressed values, overflow pages, etc. Typically used to implement storage indexes over non-numeric data.
  • Fixed Size Tree – a more compact implementation when more data is known, with int64 key and a fixed size value (which may be zero). Typically used to implement storage indexes over numeric data.
  • Multi Tree – a tree whose keys are arbitrary byte string keys and whose value is itself a tree (with no value) that can contain multiple values for a single entry. Used to implement non-unique storage indexes.
  • Compact Tree – a tree for arbitrary byte string keys to an int64 value. The keys are compressed and we can pack a lot of values in a single page. Used to handle the field terms in Corax.
  • Set – a tree used to efficiently store int64 values in an ordered manner without duplicates. The data is heavily compressed and is used to handle large posting lists in Corax.

And I’m probably forgetting a few. Those are all various permutations on a B+Tree. And together they create a really interesting set of capabilities for Voron. Today I want to talk to you about an issue we ran into when building Corax, in particular, this one:

image

Before we dive into exactly what is going on here, I feel that I need to give some background. Corax is an indexing engine, and at its core is an inverted index. When we need to delete an entry, we need to remove references to it from all the terms that it is a part of. The code producing the above is implemented roughly like this:

That particular piece accounts for almost 80% of the indexing commit time (and a significant fraction of the total indexing time). That is… just the way it is, I’m afraid. We have to process things in this manner. Lucene does things differently, it will mark the entry as deleted (and then ignore it afterward) eventually merging the results away. I really didn’t want to go in that route. One of the key design principles for Corax is that we want to avoid deferred payments, we want to pay everything in “cash” right now.

If we look deeper into the DeleteCommit() function, we can see some interesting details:

image

The DeleteIdFromExactTerm() is the piece that is doing the majority of the work, accounting for over 60% of the runtime for processing deletes. Let’s dig deeper here:

image

And we can see that this is actually really fast. The total cost for invoking this method is 5.5 μs. The problem is that we invoke it 4 million times.

And looking into the actual costs, what is the issue? It is the TryGetValue() and FindPageFor() calls, those scan through the tree structure to find the relevant place from which to remove the value.

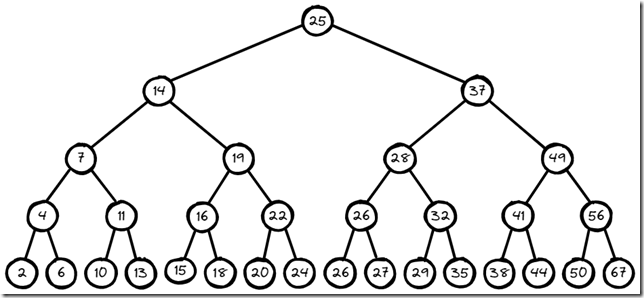
As a reminder, here is a tree structure, (it isn’t a B+Tree, mind, because we don’t need that to understand what is going on). What we have is a lot of calls to Remove() on this tree, and we always need to start searching from the root. It turns out that this is quite expensive:

image

Consider what happens if I want to remove 15 and 20. I have to compare 25, 14, 19, 16 and15. Then I have to go back to the root and compare 25, 14, 19, 22 and 20. There are a lot of commonalities here that I can take advantage of. If I can operate locally, I can probably do better, no?

We rewrote the delete code to be more like this:

The idea is that we do the deletion of terms in two stages. First, we gather all the ids we need to delete for all the terms from all the entries that are being deleted. Then we sort those values, and then we invoke a batch delete method.

Unlike the individual RemoveValue() calls, we can now take advantage of the structure of the tree. In the case of wanting to remove [15,20], we can scan the tree (25,14, 19, 16, 15)  to get to the first item that we remove. Then we proceed using the tree’s own structure. So deleting 20 means comparing (16, 19, 22, 20). In this case, we saved one operation, which isn’t that meaningful. But B+Tree’s most beautiful property is that they are dense. In this case, we are removing values from posting lists, which may contain millions of entries, and it isn’t uncommon to be able to pack thousands of entries per page. That means that the savings are huge.

This particular optimization was sufficient to ensure that we just don’t need to care about deletes any longer.

image

The ability to apply the operation in a batch fashion meant that we could amortize all of the setup costs, which lead to a far greater reaction than I actually expected, to be honest.

The code in question can make a lot of assumptions about what is going on (the input is sorted, values are present in the tree, etc). That makes things so much easier.

As a result, Corax can keep paying all costs upfront and still be so much faster than Lucene (who defers things to the background). To give some context, here are the relevant costs for Lucene:

image

Lucene spends more time processing deletes than Corax does for the whole commit process Smile. Note that this is just a small part of the costs that deletes have for Lucene, there is an excellent blog post describing those from Elastic. The costs range between 20% – 46% slowdown in queries! That is an important reason to avoid deferring work, I think we can agree.

time to read 2 min | 227 words

That actually happened over a month ago, but I’m afraid that July / August hasn’t been kind of either my attention span or the ability to actually keep track of what is happening. September is around the corner (at which point the summer vacation would be over and I’m already looking forward to some blessed routine).

The 5.4 release is a Long Term Support release, meaning that we encourage users to move their applications to use that version.

Note: support for RavenDB 5.3 will terminate on Jan 23 and the 5.2 release (also an LTS) will move to legacy support model a year after the 5.4 release.

This release brings to the table, aside from the usual minor fixes and improvements, a few major new features. The primary one is a favorite of mine, internally named etl2q. In other words, it is a native ETL support in RavenDB to push messages to Kafka and RabbitMQ. I did a whole webinar on the topic, you can watch it here.

We also added support for pulling data directly from RavenDB into Grafana, so you can create great dashboards and visualizations on your data, like so:

Dashboard screen

You can deploy RavenDB 5.4 instances in the cloud or on premise, and we have some additional goodies hidden under the engine that we are still working on.

time to read 3 min | 582 words

The design of the X509Certificate2 is badly broken in terms of safety. If you load a certificate from the disk or a byte buffer, it will go ahead and create a file on the disk behind the scene. If you’ll dispose the instance, the file will be removed. However, if you don’t explicitly dispose the instance, that is too bad. The file remains.

A ticking time bomb, because eventually you’ll have a lot of such files on the disk. Which is then a fun state to try to recover from.

I’m not sure why this design decision was made. I assume that at the time, people didn’t need to work so much with certificates, and a lot of the issues are likely with dealing with the underlying crypto API. Regardless, it is mandatory to dispose the certificate after you use it.

And that leads to a problem. Consider the following code:

The idea is that we want to be able to switch certificates on the fly (since we need to update them before they expire, without interrupting the server). Old connections can still use the old certificate, while new ones will use the updated one.

Practically speaking, the certificate itself shouldn’t be used after the call to AuthenticateAsServerAsync(), but I don’t believe that we have any such promises. Regardless, as the async designation indicates, that can take a while. How would I know to dispose the old certificate? I have to consider multi threading here as well, if I dispose the certificate while it is being used to authenticate a request, that request will likely fail. Given that I’m racing a native API and disposing its resources while it is under use, I may open some severe issues.

Ideally, the X509Certificate2 should manage that for me. If it would have implemented a finalizer, it would dispose itself when the GC made sure that no one was looking at it. That is what I want to happen, but in this case, we have no such support.

Luckily we got options. Behold the following code:

What does this do? It uses several tricks to get what we want, attaching an external finalizer to an object that we don’t control.

First, ConditionalWeakTable will ensure that as long as there is a reference to the certificate, the cleaner will be referenced as well. When there is no reference for the certificate, we’ll need to run the finalizer for the cleaner.

Next, we have the usage of CriticalFinalizerObject, this is done to ensure that the finalizer will be called even when the process terminates. This is the same manner .NET flushes file handles, so we can be sure that we are doing the utmost to ensure that we’ll properly dispose of the files.

Finally, there is the dance with the GetValueOrDefault() call in RegisterForDisposalDuringFinalization(). We need to consider what would happen if we’ll get concurrent requests to register the certificate. If we’ll let it race, one of the cleaners will be discarded, and then the finalizer will be called on that, causing havoc.

In this manner, we let ConditionalWeakTable ensure that there is just one instance, and set the value afterward. Since the value is unique per instance, we can set it multiple times (it will always be set to the same value).

End result, it takes less than 10 lines of code to fix this (and of course, remember to call register whenever you create a certificate instance). But I would really like that to just be the default behavior. Otherwise, that is a very risky trap.

time to read 4 min | 698 words

I read this blog post from Discord, which presents a really interesting approach to a problem that they ran into. Basically, in the cloud you have the choice between fast and ephemeral disks and persistent (and much slower) disks.

Technically speaking you can try to get really fast persistent disks, but those are freaking expensive. Ultra disks on Azure and io2 disks on AWS and Extreme persistent disks for GCP. The cost for a single 1TB disk with 25K IOPS would be around 1,800 USD / month, for example. That is just for the disk!

To give some context, an r6gd.16xlarge instance with 64 cores and 512 GB (!) of RAM as well as 3.8 TB of NVMe drive will cost you less than that. That machine can also do 80K IOPS, for context.

At Discord scale, they ran into the limitations of I/O in the cloud with their database and had to come up with a solution for that.

My approach would be to… not do anything, to be honest. They are using a database (ScyllaDB) that is meant to run on commodity hardware. That means that losing a node is an expected scenario. The rest of the nodes in the cluster will be able to pitch in and recover the data when the node comes back or is replaced. That looks like the perfect scenario for running with fast ephemeral disks, no?

There are two problems with ephemeral disks. First, they are ephemeral Smile, wich means that a hardware problem can make the whole disk go poof. Not an issue, that is why you are using a replicated database, no? We’ll get to that.

Another issue that is raised by Discord is that they rely on disk snapshots for backups and other important workflows. The nice thing about snapshotting a cloud disk is that it is typically fast and cheap to do. Otherwise you need to deal with higher level backup systems at the database layer. The issue is that you probably do want that, because restoring a system from a set of disk snapshots that were taken at different times and at various states is likely to be… challenging.

Discord's solution to this is to create a set of ephemeral disks that are mirrored into persistent disks. Reads are going to the fast disks and writes are spread around. A failure on the ephemeral disks will lead to a recovery of the data from the network disk.

Their post has the gory details and a lot more explanation aside. I wanted to write this post for a simple reason. As a database guy, this system scares me to pieces.

The issue is that I don’t know what kind of data consistency we can expect in such an environment. Do I get any guarantees about the equivalence of data between the fast disks and the network disk? Can they diverge from one another? What happens when you have partial errors?

Consider a transaction that modifies three different pages that end up going to three different fast disks + the network disk. If one of the fast disks has an error during write, what is written to the persistent disk?

Can I get an out-of-date read from this system if we read from the network disk for some reason? That may mean that two pages that were written in one transaction are coming back as different versions. That will likely violate assumptions and invariants and can lead to all sorts of… interesting problems.

Given that this system is meant to handle the failure modes, it sounds really scary because it is an additional layer of complexity (and one that the database is unaware of) to deal with.

Aside from the snapshots, I assume that the reason for this behavior is to avoid the cost of rebuilding a node when there is a failure. I don’t have enough information to say what is the failure rate and the impact on the overall system, but the solution provided is elegant, beautiful, and quite frankly, pretty scary to me.

There have been quite a few unknowns that we had to deal with in the realm of storage. But this adds a whole new layer of things that can break.

time to read 4 min | 613 words

Around 2017 we needed to test RavenDB with realistic datasets. That was the time that we were working hard on the 4.0 release, and we wanted to have some common dataset that was production quality (for all the benefits and complications that this brings) to play with.

A serious issue was that we needed that dataset to also be public, because we wanted to discuss its details. The default dataset people usually talk about in such a scenario is the Enron emails, but that is around half a million documents and quite small, all things considered.

Luckily for us, Stack Overflow has made their dataset publicly available in a machine readable format. That means that we could take that, adapt that to RavenDB and use that to test various aspects of our behaviors with realistic data.

The data is distributed as a set of XML files, so I quickly wrote something that would convert the data to a JSON format and adapt the model to a more relational one. The end result was a dataset with 18 million documents and with a hefty size of 52 GB. I remember that at the time, working with this data was a lengthy process. Importing the data took a long time and indexing even longer.

A few years later, this is still our go-to dataset for anything involving non-trivial amount of data, but we have gotten to the point where the full process of working with it has shrunk significantly. It used to take 45+ minutes to import the data, now it takes less than 10, for example. Basically, we made RavenDB good enough that it wasn’t that much of a challenge.

Of course… Stack Overflow continues to publish their dataset… so I decided it was time to update their data again. I no longer have the code that I used to do the initial import, but the entire process was fairly simple.

You can look at the code that is used to do the import here. This is meant to be quick & dirty code, mind you. It is about 500 lines of code and handles a surprisingly large number of edge cases.

You can find the actual data dump here.

And the explanation about the schema is here.

There is also a database diagram here.

In case you missed the point, the idea is that I want to remember how I did it for the next time I'll want to refresh our dataset.

So far, I imported a bunch of Stack Exchange communities:

  • World Building – Just over 100K documents and 1 GB in size. Small enough to play with seamlessly.
  • Super User – 1.85 million documents and weighing 4 GB in size. I think we’ll use that as the default database for showing things off on the Raspberry Pi edition.
  • Stack Overflow – 40.5 million documents and exceeding 150 GB in size. This is a great scenario for working with a significant amount of data. That is likely to be our new default benchmarking database.

The other advantage is that everyone is familiar with Stack Overflow. It makes for a great demo when we can pull up realistic data on the fly.

It already gave me some interesting details to explore. For example, enabling documents compression mode for the Super User community reduced the disk utilization to under 2 GB. That is a great space-saving, and it means that we can easily fit the entire database on a small SD card and have a “RavenDB Server + Database in a box” as a Raspberry Pi.

The Stackoverflow dataset is 150GB without compression, with documents compression, it dropped to just 57GB, which is all kinds of amazing.

They make for great demos Smile.

time to read 6 min | 1183 words

For the past couple of years, we had a stealth project going on inside of RavenDB. That project is meant to re-architect the internals of how RavenDB handles queries. The goal is to have a major performance improvement for RavenDB indexing and queries.

We spent a lot of time thinking about architecting this. Design discussions for this feature goes back to 2015, to give you some context. The codename for this project is: Corax.

Recently we finished wiring the new engine into RavenDB and for the first time in a long while, we could actually do a comparative benchmark between the two implementations. For this post, I’m going to focus solely on indexing performance, by the way.

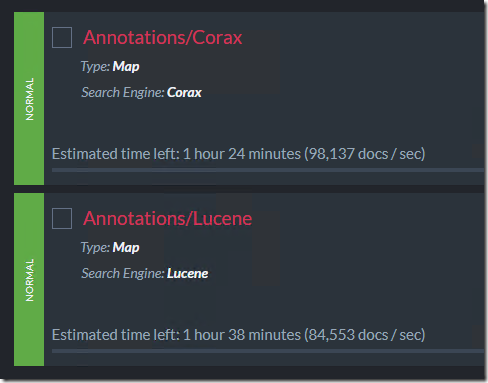
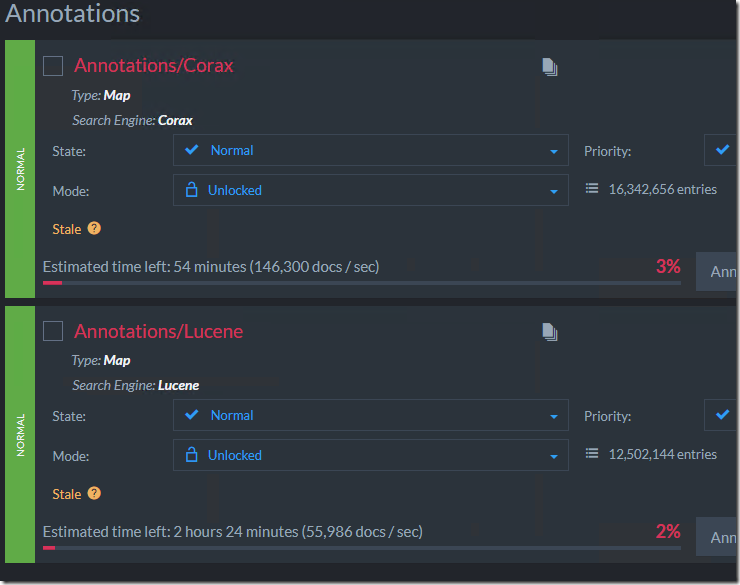
Here is a couple of (very simple) indexes working on indexing a 497 million documents.

image

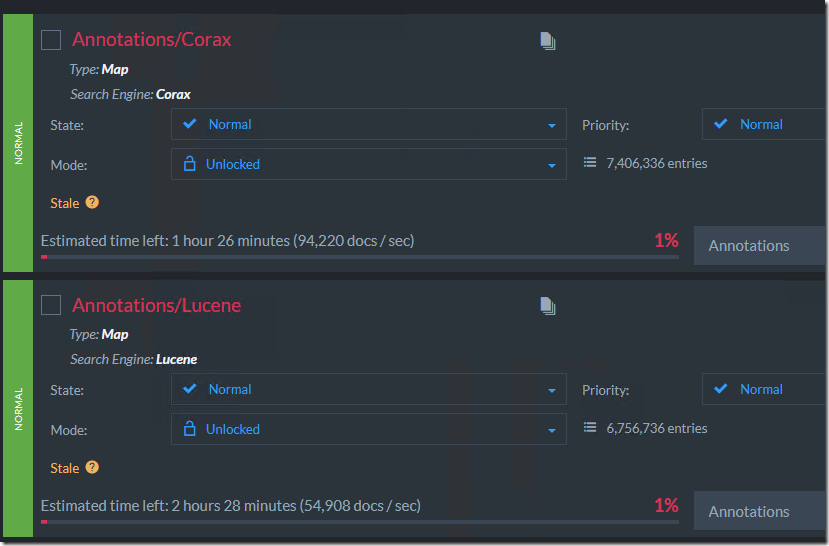
You can see that the numbers are pretty good, but we just started. Here is what the numbers look like after about 7 million documents being indexed:

image

You can see that Corax already opened up quite a gap between the two engines.

As a reminder, we have been optimizing our indexing process with Lucene for literally over a decade. We have done a lot to make things fast. Corax is still beating Lucene quite handily.

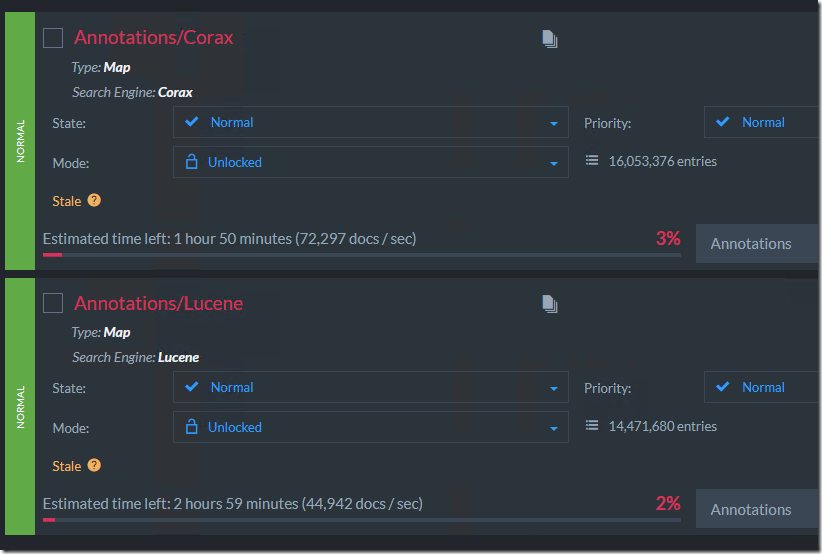
However, let’s take a look here, so far we indexed ~16 million documents and we can see that we are slowing down a bit:

image

That actually makes sense, we are doing quite a lot of work around here. It is hard to maintain the same speed when you aren’t working on a blank slate.

However, Corax was architected for speed, so while we weren’t surprised by the overall performance, we wanted more. We started analyzing what is going on. Quite quickly we figured out a truly stupendous issue in Corax.

One of the biggest problems when competing with Lucene is that it is a great library. It has certain design tradeoffs that I don’t like, but the key issue is that you can’t just build your own solution. You need to match or exceed whatever Lucene is doing.

One of the design decisions that has a major impact on how Lucene operates is that it is using an LSM model (log structured merge). This means that it writes data to immutable files (segments) and merge them occasionally. That means that handling deletes in Lucene is naturally handled during those merges. It means that Lucene can get away with tracking a lot less data about the entries that it indexed. That reduces the overall disk space it requires.

Corax takes a different approach, we don’t do compaction, because that lead to occasional spikes in computes and I/O needs. Instead, Corax uses a steady progress model. That means that it needs to track more data than Lucene.

Our first Corax indexes took about 5 – 10 times more disk space than Lucene. That isn’t a percentage, that is five to ten times bigger. One of the ways we handle this is to use an adaptive compression algorithm. We look at the entries that are being indexed and compress them. We don’t do that blindly, we generate a dictionary to match the actual entries at hand and are able to achieve some spectacular compression rate. Corax still uses more disk space than Lucene, but now the difference is in percentages, rather than in multiples.

On a regular basis, we’ll also check if the type of data that is being indexed has changed and we need to re-compute the dictionary. It turns out that we did that using a random sampling of the entries in the index. The number of samples range from 1 in 10 to 1 in 100, depending on the size of the index.

Then we threw a half billion index entries at Corax, and merely checking whether the dictionary could be better would result in us computing a dictionary with over 5 million entries. That was easily fixed, thankfully. We need to limit the scan not just in proportion to the size of the index but also globally. We can rely on the random nature of the sampling to give us a better dictionary next time, if needed. And it won’t stall the indexing process.

After jumping over the most obvious hurdles, the next stage is to pull the profiler and see what kind of bottlenecks we have in the system. Here is the first thing that popped out to me:

image

Over 10% of the indexing time is spent on adding an item to CollectionOfBloomFilters, what is that?

Well, remember how I said that Lucene optimized its file structure to handle deletes better? One of the consequences of that is that deletes can be really expensive. If you are indexing a new document (which doesn’t need to delete), you can have a significant time saving by skipping that. This is the rule of the bloom filter here. Yes, even with that cost, for Lucene it is worth it.

For Corax… however, that isn’t the case. We can just skip that cost entirely.

10.75% performance boost

Next… we have this dude:

image

That call is meant to update the number of records that Corax is holding in the index. We are updating a persistent value once for each entry that is indexed. But we can do that once for the entire batch!

2.81% performance boost

Those are easy, no? What is next?

image

For each term that we run, we rent and return a buffer. For each term! That alone takes 1% of the indexing time. Utterly ridiculous. We can use a single buffer for the entire indexing operation, after all.

As for the IsAnalayzed property? That does some (trivial) computation, but we know that the value is immutable. Make that once in the constructor and turn that property into a field.

1.33% performance boost

Those are literally just the things we noticed in the first few minutes. After applying those changes, I reset the indexing and looked at the results after it ran for a while. And now that, I’ll admit, is far more gratifying.

image

It is really interesting to see the impact of seemingly minor changes like those. Especially because the architecture holds up quite well.

Corax is proceeding quite well and we have really great hopes for it. We need to hammer on it a bit more, but it is showing a lot of promise.

The really interesting thing is that all those changes (which ended up pretty much doubling the effective indexing speed) are all relatively minor and easily fixed. That is despite the fact that we wrote Corax to be optimized, you always find surprises when you run the profiler, and sometimes they are very pleasant ones.

time to read 2 min | 342 words

We run into an interesting scenario at work that I thought would make for a pretty good interview task. Consider a server that needs to proxy a request from the outside world to an internal service, something like this:

image

That isn’t that interesting. The interesting bit is that the network between the internal server and the proxy is running at 10Gb/sec and the external network is limited to 512Kb/sec.

Furthermore, the internal server expects the other side to just… take the load. It will blast the other side with as much data as it can, and if you can’t handle that, will cut the connection. What this means is that for small requests, the proxy can successfully pass the data to the external server, but for larger ones, it is unable to read the data quickly enough to do so and the internal server will disconnect from it.

It is the responsibility of the proxy to manage that scenario.  That is the background for this task, practically speaking, this means that you have the following code, which works if the size is 8MB but fails if it is 64MB.

We have the SlowClientStream and the FastServerStream – which means that we are able to focus completely on the task at hand (ignoring networks, etc).

The requirement is to pass a 64 MB of data between those two streams (which have conflicting requirements)

  • The FastServerStream requires that you’ll read from it in a rate of about 31Kb / sec.
  • The SlowClientStream, on the other hand, will accept data at a maximum rate of about 30Kb/sec (but is variable across time).

You may not change the implementation of either stream (but may add behavior in separate classes).

You may not read the entire response from the server before sending to the client.

There is a memory limit of 32 MB on the maximum amount of memory you may use in the program.

How would you go about solving this?

The challenge skeleton is here.

time to read 6 min | 1163 words

Today I had to look into the a customer whose RavenDB instance was burning through a lot of I/O. The process is somewhat ingrained in me by this point, but I thought that it would make for a good blog post so I’ll recall that next time.

Here is what this looks like from the point of view of the disk:

image

We are seeing a lot of reads in terms of MB/sec and a lot of write operations (but far less in terms of bandwidth). That is the external details, can we figure out more? Of course.

We start our investigation by running:

sudo iotop -ao

This command gives us the accumulative time for threads that do I/O. One of the important things that RavenDB is to tag its threads with the tasks that they are assigned. Here is a sample output:

  TID  PRIO  USER     DISK READ DISK WRITE>  SWAPIN      IO    COMMAND
 2012 be/4 ravendb    1748.00 K    143.81 M  0.00 %  0.96 % Raven.Server -c /ravendb/config/settings.json [Follower thread]
 9533 be/4 ravendb     189.92 M     86.07 M  0.00 %  0.60 % Raven.Server -c /ravendb/config/settings.json [Indexing of Use]
 1905 be/4 ravendb     162.73 M     72.23 M  0.00 %  0.39 % Raven.Server -c /ravendb/config/settings.json [Indexing of Use]
 1986 be/4 ravendb     154.52 M     71.71 M  0.00 %  0.38 % Raven.Server -c /ravendb/config/settings.json [Indexing of Use]
 9687 be/4 ravendb     185.57 M     70.34 M  0.00 %  0.59 % Raven.Server -c /ravendb/config/settings.json [Indexing of Car]
 1827 be/4 ravendb     172.60 M     65.25 M  0.00 %  0.69 % Raven.Server -c /ravendb/config/settings.json ['Southsand']

In this case, we see the top 6 threads in terms of I/O (for writes). We can see that we have a lot of of indexing and documents writes. That said, thread names in Linux are limited to 14 characters, so we probably need to give better names to them.

That is part of the task, let’s look at the cost in terms of reads:

  TID  PRIO  USER    DISK READ>  DISK WRITE  SWAPIN      IO    COMMAND
11191 be/4 ravendb       2.09 G     31.75 M  0.00 %  7.58 % Raven.Server -c /ravendb/config/settings.json [.NET ThreadPool]
11494 be/4 ravendb    1353.39 M     14.54 M  0.00 % 19.62 % Raven.Server -c /ravendb/config/settings.json [.NET ThreadPool]
11496 be/4 ravendb    1265.96 M      4.97 M  0.00 % 16.56 % Raven.Server -c /ravendb/config/settings.json [.NET ThreadPool]
11211 be/4 ravendb    1120.19 M     42.66 M  0.00 %  2.83 % Raven.Server -c /ravendb/config/settings.json [.NET ThreadPool]
11371 be/4 ravendb    1114.50 M     35.25 M  0.00 %  5.00 % Raven.Server -c /ravendb/config/settings.json [.NET ThreadPool]
11001 be/4 ravendb    1102.55 M     43.35 M  0.00 %  3.12 % Raven.Server -c /ravendb/config/settings.json [.NET ThreadPool]
11340 be/4 ravendb     825.43 M     26.77 M  0.00 %  4.85 % Raven.Server -c /ravendb/config/settings.json [.NET ThreadPool]

That is a lot more complicated, however. Now we don’t know what task this is running, only that something is reading a lot of data.

We have the thread id, so we can make use of that to see what it is doing:

sudo strace -p 11191 -c

This command will track the statistics on the systems calls that are issued by the specified thread. I’ll typically let it run for 10 – 30 seconds and then hit Ctrl+C, giving me:

% time     seconds  usecs/call     calls    errors syscall
------ ----------- ----------- --------- --------- ----------------
 90.90    3.868694         681      5681        82 futex
  8.28    0.352247           9     41035           sched_yield
  0.79    0.033589        1292        26           pwrite64
  0.03    0.001246          52        24         1 recvfrom
  0.01    0.000285         285         1           restart_syscall
  0.00    0.000000           0         2           madvise
  0.00    0.000000           0         2           sendmsg
------ ----------- ----------- --------- --------- ----------------
100.00    4.256061                 46771        83 total

I’m mostly interested in the pwrite64 system call. RavenDB uses mmap() for most of its data access, so that is harder to read, but we can get a lot of information from the output. Now I’m going to run the following command:

sudo strace -p 11191 -e trace=pwrite64

This will give us a trace of all the pwrite64() system calls from that thread, looking like this:

pwrite64(315, "\365\275"..., 4113, 51080761896) = 4113
pwrite64(315, "\344\371"..., 4113, 51080893512) = 4113

There is an strace option (-y) that can be used to show the file paths for system calls, but I forgot to use it, no worries, I can do:

sudo ls -lh /proc/11191/fd/315

Which will give me the details on this file:

lrwx------ 1 root root 64 Aug  7 09:21 /proc/11783/fd/315 -> /ravendb/data/Databases/Southsand/PeriodicBackupTemp/2022-08-07-03-30-00.ravendb-encrypted-full-backup.in-progress

And that tells me everything that I need to know. The reason we have high I/O is that we are generating a backup file. That explains why we are seeing a lot of reads (since we need to read in order to generate the backup).

The entire process is mostly about figuring out exactly what is going on, and RavenDB is very careful about leaving as many breadcrumbs as possible to make it easy to follow.

time to read 4 min | 636 words

A customer was experiencing large memory spikes in some cases, and we were looking into the allocation patterns of some of the queries that were involved. One of the things that popped up was a query that allocated just under 30GB of managed memory during its processing.

Let me repeat that, because it bears repeating. That query allocated 30(!) GB(!) during its execution. Now, that doesn’t mean that it was consuming 30 GB, it was just the allocations involved. Most of that memory was immediately discarded during the operation. But 30 GB of garbage to cleanup puts a lot of pressure on the system. We took a closer look at the offensive query. It looked something like this:

from index “Notifications/RoutingAndPriority”
where startsWith(Route, $routeKeyPrefix)
order by
Priority desc

That does not seem like a query that should be all that expensive. But details matter, so we dove into this. For this particular query, the routes are hierarchical structures that are unique for each message. Something like:

  • notifications/traffic/new-york-city/67a81019-941b-4d04-a0db-0559ed45343c
  • notifications/emergency/las-vegas/0a8e18fb-563b-4b6a-8e93-e10e08239656

And the queries that were generated were using the city & topic to filter the information that they were interested in.

The customer in question had a lot of notifications going on at all times. And each one of their Routes was unique. Internally, RavenDB uses Lucene (currently Smile ) to handle searches, and Lucene is using an inverse index to execute queries.

The usual way to think about is like this:

image

We have a list of terms (Brown, Green & Purple) and each of them has a list of the matching documents that contain the particular term.

The process of issuing a prefix query then is easy, scan all entries that match the prefix and return their results. This is indeed what Lucene is doing. However… while it is doing that, it will do something like this:

Pay close attention to what is actually happening here. There are two enumerators that we work with. One for the terms for the field and one for the documents for a specific term.

All of this is perfectly reasonable, but there is an issue. What happens when you have a lot of unique values? Well, then Lucene will have a lot of iterations of the loop. In this case, each term has just a single match, and Lucene is pretty good at optimizing search by specific term.

The actual problem is that Lucene allocates a string instance for each term. If we have 30 million notifications for New York’s traffic, that means that we’ll allocate 30 million strings during the processing of the query. We aren’t retaining these strings, mind. They’ll be cleaned up by the GC quickly enough, but that is an additional cost that we don’t actually want.

Luckily, in this case, there is a much simple solution. Given that the pattern of the route is known, we can skip the unique portion of the route. That means that in our index, we’ll do something similar to:

Route = doc.Route.Substring(0, doc.Route.LastIndexOf('/') + 1)

Once that is done, the number of unique matches there would be negligible. There would be no more allocations galore to observe and overall system performance is much improved.

We looked into whether there is something that we can do with Lucene to avoid this allocations issue, but it is endemic to the way the API works. The longer term plan is to fix that completely, of course. We are making great strides there already Smile.

In short, if you are doing startsWith() queries or similar, pay attention to the number of unique terms that you have to go through. A simple optimization on the index like the one above can bring quite a bit of dividends.

FUTURE POSTS

No future posts left, oh my!

RECENT SERIES

  1. Challenge (75):
    01 Jul 2024 - Efficient snapshotable state
  2. Recording (14):
    19 Jun 2024 - Building a Database Engine in C# & .NET
  3. re (33):
    28 May 2024 - Secure Drop protocol
  4. Meta Blog (2):
    23 Jan 2024 - I'm a JS Developer now
  5. Production Postmortem (51):
    12 Dec 2023 - The Spawn of Denial of Service
View all series

RECENT COMMENTS

Syndication

Main feed Feed Stats
Comments feed   Comments Feed Stats
}