Oren Eini

CEO of RavenDB

a NoSQL Open Source Document Database

Get in touch with me:

oren@ravendb.net +972 52-548-6969

Posts: 7,524
|
Comments: 51,159
Privacy Policy · Terms
filter by tags archive
time to read 3 min | 547 words

AvatarCrane01-300pxAs we continuously optimized more and more of our code, we kept seeing faster and faster benchmarks. In fact, the more we optimized, the faster we became. One would think that there is some sort of correlation there.

However, that is a mere theory that can be disproven, as this story will demonstrate.

When optimizing, you eventually expects to get into the land of diminishing returns. But something very strange happened, we have made a few changes, the each should have brought our speed up by a significant percentage, we had the micro benchmarks to prove that this is the case, and we were even able to see that the code was running much faster than before, but the overall benchmark time kept growing, and we started seeing higher and higher stalls in the process.

That… sucked. Especially because we couldn’t figure out what was going on. Every single metric we could see was saying that we should be seeing higher speed, our disk usage went up, our CPU usage went up a bit, we increased our memory buffers from 32 MB to 1GB, and every single indication we had told us that we are faster on a per operation basis. But the entire thing just started slowing down more and more.

Frustratingly, there was nothing we could really sink our teeth into. The system would just go into stalls and do nothing. We got to the point it looked like we broke the operating system, but nothing helped, stuff just didn’t want to work. It looked like we were waiting for I/O, but tracing at the syscall level showed that we were getting much faster response from the hardware than we saw in the application. Somewhere, stuff was getting lost.

Eventually we managed to track it down to the offending line:

image

So this is pretty obvious, right? We are waiting, so we are slow. But this line is called from a completely different part of the code, and it isn’t blocking anything else in the code path that is suffering from stalls. The key here is that this line is called from:

image

Still fine, right? We threw that into the thread pool, so it is fine to wait. But…

image

The line above is responsible for releasing our threads when the I/O operation has completed. Note that it needs to run on the thread pool as well, but because we are now much faster, we now have a lot of threads that are stuck in the call to SyncEnvironment, that overloaded the thread pool, and meant that the notification that we can proceed would come very late. We missed it in all of our profiling because we didn’t look at that code path at all, since it was obviously unrelated to the issue at hand.

time to read 7 min | 1306 words

Originally posted at 1/18/2011

We got some reports that there was an O(N) issue with loading large number of documents from Raven.

I wrote the following test code:

var db = new DocumentDatabase(new RavenConfiguration
{
    DataDirectory = "Data"
});
Console.WriteLine("Ready");
Console.ReadLine();
while (true)
{
    var sp = Stopwatch.StartNew();

    db.Query("Raven/DocumentsByEntityName", new IndexQuery
    {
        Query = "Tag:Item",
        PageSize = 1024
    });

    Console.WriteLine(sp.ElapsedMilliseconds);
}

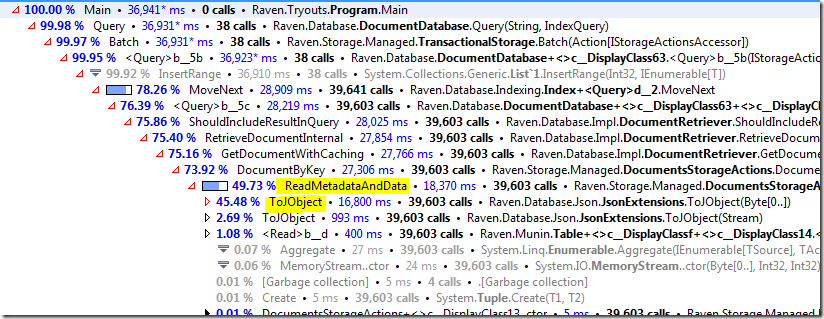
With 1,024 documents in the database, I could clearly see that most requests took in the order of 300 ms. Not content with that speed, I decided to dig deeper, and pulled out my trusty profiler (dotTrace, and no, I am not getting paid for this) and got this:

image

As should be clear, it seems like de-serializing the data from byte[] to a JObject instance is taking a lot of time (relatively speaking).

To be more precise, it takes 0.4 ms, to do two deserialization operations (for the following document):

{
    "cartId": 666,
    "otherStuff": "moohahaha",
    "itemList": [{
        "productId": 42,
        "name": "brimstone",
        "price": 6.66,
        "quantity": 2000
    },
    {
        "productId": 42,
        "name": "brimstone",
        "price": 6.66,
        "quantity": 2000
    },
    {
        "productId": 42,
        "name": "brimstone",
        "price": 6.66,
        "quantity": 2000
    },
    {
        "productId": 42,
        "name": "brimstone",
        "price": 6.66,
        "quantity": 2000
    },
    {
        "productId": 42,
        "name": "brimstone",
        "price": 6.66,
        "quantity": 2000
    },
    {
        "productId": 42,
        "name": "brimstone",
        "price": 6.66,
        "quantity": 2000
    },
    {
        "productId": 42,
        "name": "brimstone",
        "price": 6.66,
        "quantity": 2000
    },
    {
        "productId": 42,
        "name": "brimstone",
        "price": 6.66,
        "quantity": 2000
    }]
}

I found it quite surprising, to tell you the truth. I wrote the following test case to prove this:

static void Main()
{
    
    var st =
        "IQAAAAJSYXZlbi1FbnRpdHktTmFtZQAFAAAASXRlbQAAvgIAABJjYXJ0SWQAmgIAAAAAAAACb3RoZXJTdHVm"+
        "ZgAKAAAAbW9vaGFoYWhhAARpdGVtTGlzdACFAgAAAzAATQAAABJwcm9kdWN0SWQAKgAAAAAAAAACbmFtZQAKA"+
        "AAAYnJpbXN0b25lAAFwcmljZQCkcD0K16MaQBJxdWFudGl0eQDQBwAAAAAAAAADMQBNAAAAEnByb2R1Y3RJZAA"+
        "qAAAAAAAAAAJuYW1lAAoAAABicmltc3RvbmUAAXByaWNlAKRwPQrXoxpAEnF1YW50aXR5ANAHAAAAAAAAAAMy"+
        "AE0AAAAScHJvZHVjdElkACoAAAAAAAAAAm5hbWUACgAAAGJyaW1zdG9uZQABcHJpY2UApHA9CtejGkAScXVhbn"+
        "RpdHkA0AcAAAAAAAAAAzMATQAAABJwcm9kdWN0SWQAKgAAAAAAAAACbmFtZQAKAAAAYnJpbXN0b25lAAFwcmljZ"+
        "QCkcD0K16MaQBJxdWFudGl0eQDQBwAAAAAAAAADNABNAAAAEnByb2R1Y3RJZAAqAAAAAAAAAAJuYW1lAAoAAABi"+
        "cmltc3RvbmUAAXByaWNlAKRwPQrXoxpAEnF1YW50aXR5ANAHAAAAAAAAAAM1AE0AAAAScHJvZHVjdElkACoAAAAAA"+
        "AAAAm5hbWUACgAAAGJyaW1zdG9uZQABcHJpY2UApHA9CtejGkAScXVhbnRpdHkA0AcAAAAAAAAAAzYATQAAABJwcm9"+
        "kdWN0SWQAKgAAAAAAAAACbmFtZQAKAAAAYnJpbXN0b25lAAFwcmljZQCkcD0K16MaQBJxdWFudGl0eQDQBwAAAAAAAA"+
        "ADNwBNAAAAEnByb2R1Y3RJZAAqAAAAAAAAAAJuYW1lAAoAAABicmltc3RvbmUAAXByaWNlAKRwPQrXoxpAEnF1YW50a"+
        "XR5ANAHAAAAAAAAAAAA";
    var buffer = Convert.FromBase64String(st);

    while (true)
    {
        var sp = Stopwatch.StartNew();
        for (int i = 0; i < 1024; i++)
        {
            DoWork(buffer);
        }
        Console.WriteLine(sp.ElapsedMilliseconds);
    }
}

private static void DoWork(byte[] buffer)
{
    var ms = new MemoryStream(buffer);
    JObject.Load(new BsonReader(ms));
    JObject.Load(new BsonReader(ms));
}

On my machine, this run at around 70ms for each 1,204 run. In other words, it takes significantly less I would have thought. Roughly 0.06 ms.

Note: The first number (0.4 ms) is under the profiler while the second number (0.06ms) is outside the profiler. You can routinely see order of magnitude differences between running inside and outside the profiler!

So far, so good, but we can literally see that this is adding almost a 100 ms to the request processing. That is good, because it is fairly simple to fix.

What I did was introduce a cache inside the serialization pipeline that made the entire cost go away. Indeed, running the same code above showed much better performance, an average of 200 ms.

The next step is to figure out where is the next cost factor… For that, we use the profiler.

image

And… we can see the the cost of de-serializing went drastically down. Now the actual cost is just doing a search for the document by the key.

You might have noticed that those results are for Munin. I have run the same test results with Esent, with remarkable similarity in the overall performance.

FUTURE POSTS

No future posts left, oh my!

RECENT SERIES

  1. Challenge (75):
    01 Jul 2024 - Efficient snapshotable state
  2. Recording (14):
    19 Jun 2024 - Building a Database Engine in C# & .NET
  3. re (33):
    28 May 2024 - Secure Drop protocol
  4. Meta Blog (2):
    23 Jan 2024 - I'm a JS Developer now
  5. Production Postmortem (51):
    12 Dec 2023 - The Spawn of Denial of Service
View all series

Syndication

Main feed Feed Stats
Comments feed   Comments Feed Stats
}