Oren Eini

CEO of RavenDB

a NoSQL Open Source Document Database

Get in touch with me:

oren@ravendb.net +972 52-548-6969

Posts: 7,589
|
Comments: 51,218
Privacy Policy · Terms
filter by tags archive
time to read 2 min | 366 words

I asked the following question, about code that uses AsyncLocal as well as async calls. Here is the code again:

This code prints False twice, the question is why. I would expect that the AsyncLocal value to remain the same after the call to Start(), since that is obviously the point of AsyncLocal. It turns out that this isn’t the case.

AsyncLocal is good if you are trying to pass a value down to child tasks, but it won’t be applicable to other tasks that are called in the same level. In other words, it works for children, not siblings tasks. This is actually even more surprising in the code above, since we don’t do any awaits in the Start() method.

The question is why? Looking at the documentation, I couldn’t see any reason for that. Digging deeper into the source code, I figured out what is going on.

We can use SharpLab.io to lower the high level C# code to see what is actually going on here, which gives us the following code for the Start() method:

Note that we call to AsyncTaskMethodBuilder.Start() method, which ends up in AsyncMethodBuilderCore.Start(). There we have a bunch of interesting code, in particular, we remember the current thread execution context before we execute user code, here. After the code is done running, we restore it if this is needed, as you can see here.

That looks fine, but why would the execution context change here? It turns out that one of the few places that interact with it is the AsyncValue itself, which ends up in the ExecutionContext.SetLocalValue. The way it works, each time you set an async local, it creates a new layer in the async stack. And when you exit an async call, it will reset the async stack to the place it was before the async call started.

In other words, the local in the name AsyncLocal isn’t a match to ThreadLocal, but is more similar to a local variable, which goes out of scope on function exit.

This isn’t a new thing, and there are workarounds, but it was interesting enough that I decided to dig deep and understand what is actually going on.

time to read 2 min | 229 words

A user contacted us to tell us that RavenDB does not work in his environment. As you can imagine, we didn’t really like to hear that, so we looked deeper into the issue. The issue in question included the actual problem, which looked something like this:

{
    "Url": "/auth/",
    "Type": "Raven.Client.Exceptions.Routing.RouteNotFoundException",
    "Message": "There is no handler for path: GET /auth/",
    "Error": "Raven.Client.Exceptions.Routing.RouteNotFoundException: There is no handler for path: GET /auth/\n"
}

My reaction to that was… huh?!

That is a really strange error, since RavenDB does not have an “/auth/” endpoint. The problem isn’t with RavenDB, it is with something else.

In this case, the user ran RavenDB on port 8080 (which is the normal thing to do) and then tried to access RavenDB in the browser.

The problem was that they previously ran some other software, and that software had the following interaction:

* Connected to 127.0.0.1 port 8080
> GET / HTTP/1.1
> Host: 127.0.0.1
> User-Agent: curl/7.85.0
> Accept: */*
>
< HTTP/1.1 301 Moved Permanently
< Location: http://127.0.0.1:8080/auth/
< Content-Type: text/html; charset=UTF-8

In other words, it redirected the browser to the “/auth/” endpoint. It’s critical to understand that 301 response means: Moved Permanently. That means that they are actually cached by the browser. In this case, the scenario was reusing the same endpoint for a different software product, and the browser cache meant that we got strange results.

time to read 3 min | 457 words

A customer called us with a problem. They set up a production cluster successfully, they could manually verify that everything is working, except that it would fail when they try to connect to it via the client API.

The error in question looked something like this:

CertificateNameMismatchException: You are trying to contact host rvn-db-72 but the hostname must match one of the CN or SAN properties of the server certificate: CN=rvn-db-72, OU=UAT, OU=Computers, OU=Operations, OU=Jam, DC=example, DC=com, DNS Name=rvn-db-72.jam.example.com

That is… a really strange error. Because they were accessing the server using: rvn-db-72.jam.example.com, and that was the configured certificate for it. But for some reason the RavenDB client was trying to connect directly to rvn-db-72. It was able to connect to it, but failed on the hostname validation because the certificates didn’t match.

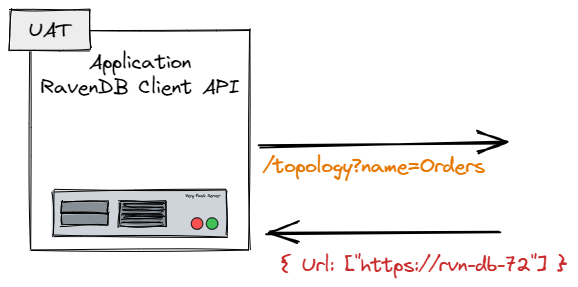
Initially, we suspected that there is some sort of a MITM or some network appliance that got in the way, but we finally figured out that we had the following sequence of events, shown in the image below. The RavenDB client was properly configured, but when it asked the server where the database is, the server would give the wrong URL, leading to this error.

image

This deserves some explanation. When we initialize the RavenDB client, one of the first things that the client does is query the cluster for the URLs where it can find the database it needs to work with. This is because the distribution of databases in a cluster doesn’t have to match the nodes in the cluster.

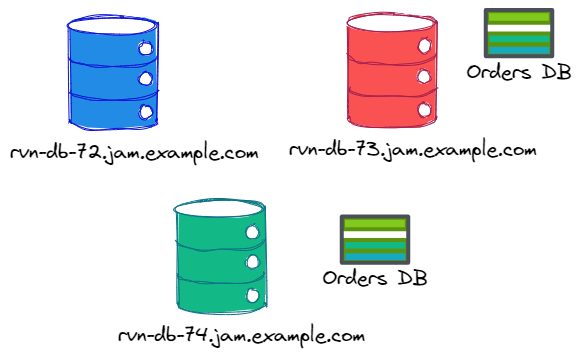
Consider this setup:

image

In this case, we have three nodes in the cluster, but the “Orders DB” is located only on two of them. If we query the rvn-db-72 database for the topology of “Orders DB”, we’ll get nodes rvn-db-73 and rvn-db-74. Here is what this will look like:

image

Now that we understand what is going on, what is the root cause of the problem?

A misconfigured server, basically. The PublicServerUrl for the server in question was left as the hostname, instead of the full domain name.

This configuration meant that the server would give the wrong URL to the client, which would then fail.

This is something that only the client API is doing, so the Studio behaved just fine, which made it harder to figure out what exactly is going on there. The actual fix is trivial, naturally, but figuring it out took too long. We’ll be adding an alert to detect and resolve misconfigurations like that in the future.

time to read 6 min | 1157 words

RavenDB has a really nice feature, it allows you to index data from related documents. Consider the following document structure:
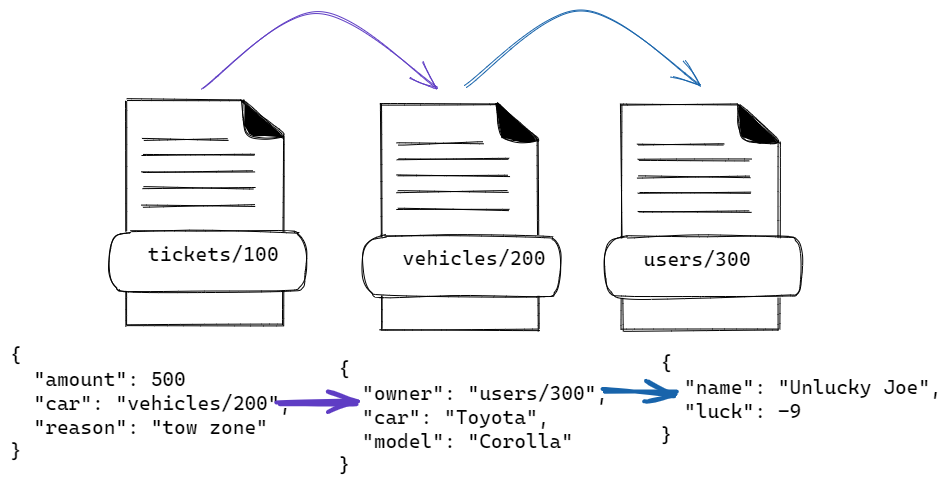
image

We have tickets, vehicles, and users, and we want to issue a search on all the tickets issued to Joe. Leaving aside whether this is the proper way to handle this, here is what the index would look like:

What we are doing here is walk the reference graph and index data from related documents. So far, so good. The cool thing about this feature is that RavenDB is in charge of ensuring that if we update the owner of the vehicle or the name of the user, the Right Thing will happen.

Of course, I wouldn’t be writing this blog post if we didn’t run into a problem in this scenario.

The way it works, for each collection referenced by the index, RavenDB maintains a list of the last document that was chceked for changes in the collection. That way, on modification of a related document, we can tell that we need to re-index a particular document.

This looks something like this:

In other words, for each document that was loaded by another during indexing, we keep a list of the referencing documents.

Let’s say that we update document vehicles/200. That would be written to the storage with a new etag, and the index would wake up. It would ask to get all the documents in the Vehicles collection after etag 456, get vehicles/200 and then check the ReferencedBy and find that the document tickets/100 loaded it. At this point, it will re-index tickets/100 to ensure we have the latest values.

There is quite a bit more to this process, of course, I’m skipping on a lot of optimizations and detail work. For the purpose of this post, we don’t need any of that.

A customer reported that (very rarely), an index similar to the one above would “miss” on updates. That should not be possible. As much as I love this feature, conceptually, it is a very simple one, there isn’t much here that can fail. And yet, it did. Figuring out what was happening required us to look very deeply into the exact series of steps that were taken to produce this output. It turns out that our approach had a hole in it.

We assume that the writes would always happen in an orderly fashion. In other words, that the writes would be consistent. But there is no actual requirement for that.

Consider what happens if I write just the ticket document to the database:

  • RavenDB will index the ticket document
  • It will attempt to load the associated vehicle, figure out that there is no such document and move on
  • The related user document, of course, is not known at this point (since there is no vehicle document)

The end result is that we have the following data internally:

That is fine, when we’ll add the vehicle and the user, we’ll do the appropriate wiring, no?

In almost all cases, that is exactly what will happen. However, consider the metadata above. We are concerned here with tickets/100, but there is also tickets/20, whose references exist properly. So the structure we have right now in terms of reference tracking is:
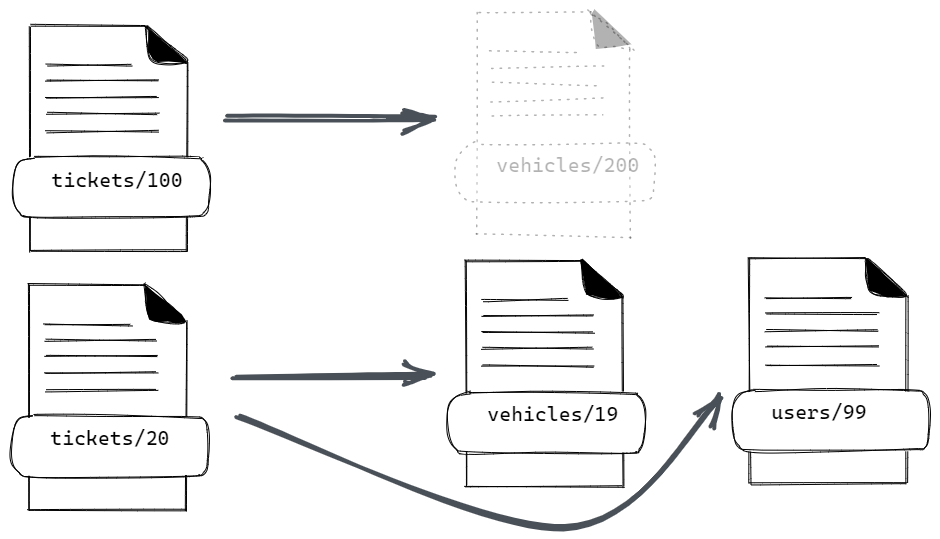
image

It’s important to note that the references are always kept from the initial 'tickets' document. So even though the path from tickets/20 to users/99 goes through vehicles/19, the relationship is a direct association.

What will happen if we’ll insert just the users/300 document now? Well, there is no reference to this document, so we’ve no reason to do anything with it. But that isn’t a problem. When vehicles/200 is inserted, this will be fixed.

On the other hand, if we add just vehicles/200 to the database (with users/300 not being present), that is a change in a tracked document, which will cause us to index the referencing document (tickets/100) again and move us to this state:

image

When we will then add users/300, document tickets/100 will have the record of this reference and we’ll re-index it.

In other words, we are covered on both sides. Except, that there is still this pesky (and impossible) problem that the user is seeing.

Now, consider the following state of affairs, we are back in the initial state, both vehicles/200 and users/300 are missing in the database and tickets/20, vehicles/19 and users/99 are there.

We add vehicles/200 to the database, and there is a re-indexing process going on. At the same time that we re-index tickets/100 because of the new vehicles/200 document, we are adding the users/300 document in a separate transaction.

That means that during the indexing of tickers/100, we’ll see document vehicles/200 but not the users/300 document (even though it exists).

That is still not a problem, we’ll write the referencing record and on the next batch, detect that we have a user that we haven’t seen and re-index the document again.

Except… what if we didn’t update just the users/300 document in this case, what if we also updated users/99 at the same transaction (and after we insert document users/300).

Depending on the exact timings, we may end up missing document users/300 (because there was no reference to it at the time) but will notice that document users/99 was updated (we already had it referenced). Since users/99 was modified after users/300, we’ll record that we observed all the changes in the Users collection before users/99. That, crucially, also includes the users/300 that we never noticed.

This is confusing, I’ll freely admit. In order to reproduce this bug you need a non-standard pattern for creating references, a chain of at least two references, multiple independent references with different states, and an unlucky draw from Murphy with the exact timing of transactions, indexing and order of operations.

The root cause was that we recorded the newly added document reference in memory, and only updated them when the entire indexing batch was completed. During that time, there may have been multiple transactions that modified the documents. But because we didn’t sync the state until the end of the batch, we would end up missing this case. Solving the problem once we knew what was going on involved moving a single line of code from the outer loop to an inner one, basically.

Writing a reproducible test case was actually far harder, since so many things had to fall just so this would happen. I have to admit that I don’t have any strong conclusions about this bug. It isn’t something systematic or an issue that we missed. It is a sequence of unfortunate events with a very low probability of occurring that we  never actually considered.

The really good thing about this issue is that it is the first one in this particular area of the code in quite some time. That means that this has been quite stable for many scenarios.

time to read 1 min | 169 words

We have a lot of tests for RavenDB, and we are running them on plenty of environments. We semi frequently get a build failure when running on the “macOS latest” runner on GitHub.

The problem is that the information that I have is self-contradicting. Here is the most relevant piece:

Here you can see the failure itself and what is causing it.

Note that the debug message is showing that all three variables here have the same numeric value. The address and the current variables are also held on the stack, so there is no option for race conditions, or something like that.

I can’t figure out any reason why this would be triggered, in this case. About the only thing that pops to mind is whether there is some weirdness going on with pointer comparisons on MacOS, but I don’t have a lead to follow.

We haven’t investigated it properly yet, I thought to throw this to the blog and see if you have any idea what may be going on here.

time to read 4 min | 653 words

RavenDB is written in C#, and as such, uses managed memory. As a database, however, we need granular control of our memory, so we also do manual memory management.

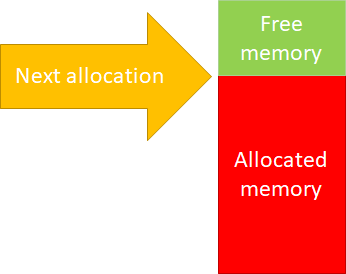
One of the key optimizations that we utilize to reduce the amount of overhead we have on managing our memory is using an arena allocator. That is a piece of memory that we allocate in one shot from the operating system and operate on. Once a particular task is done, we can discard that whole segment in one shot, rather than try to work out exactly what is going on there. That gives us a proper scope for operations, which means that missing a free in some cases isn’t the end of the world.

It also makes the code for RavenDB memory allocation super simple. Here is what this looks like:

image

Whenever we need to allocate more memory, we’ll just bump the allocator up. Initially, we didn’t even implement freeing memory, but it turns out that there are a lot of long running processes inside of RavenDB, so we needed to reuse the memory inside the same operation, not just between operations.

The implementation of freeing memory is pretty simple, as well. If we return the last item that we allocated, we can just drop the next allocation position by how many bytes were allocated. For that matter, it also allows us to do incremental allocations. We can ask for some memory, then increase the allocation amount on the fly very easily.

Here is a (highly simplified) example of how this works:

As you can see, there isn’t much there. A key requirement here is that you need to return the memory back in the reverse order of how you allocated it. That is usually how it goes, but what if it doesn’t happen?

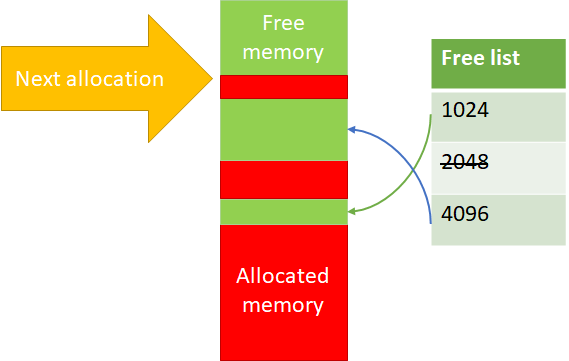
Well, then we can’t reuse the memory directly. Instead, we’ll place them in a free list. The actual allocations are done on powers of two, so that makes things easier. Here is what this actually looks like:

image

So if we free, but not from the top, we remember the location and can use it again. Note that for 2048 in the image above, we don’t have any free items.

I’m quite fond of this approach, since this is simple, easy to understand and has a great performance profile.  But I wouldn’t be writing this blog post if we didn’t run into issues, now would I?

A customer reported high memory usage (to the point of memory exhaustion) when doing a certain set of operations. That… didn’t make any sense, to be honest. That was a well traveled code path, any issue there should have been long found out.

They were able to send us a reproduction and the support team was able to figure out what is going on. The problem was that the code in question did a couple of things, which altogether led to an interesting issue.

  • It allocated and deallocated memory, but not always in the same order – this is fine, that is why we have the free list, after all.
  • It extended the memory allocation it used on the fly – perfectly fine and an important optimization for us.

Give it a moment to consider how could these two operations together result in a problem…

Here is the sequence of events:

  • Loop:
    • Allocate(1024) -> $1
    • Allocate(256) -> $2
    • Grow($1, 4096) -> Success
    • Allocate(128) -> $3
    • Free($1) (4096)
    • Free($3) (128)
    • Free($2) (256)

What is going on here?

Well, the issue is that we are allocating a 1KB buffer, but return a 4KB buffer. That means that we add the returned buffer to the 4KB free list, but we cannot pull from that free list on allocation.

Once found, it was an easy thing to do (detect this state and handle it), but until we figured it out, it was quite a mystery.

time to read 5 min | 902 words

When we are handling a support call, we are often working with partial information about the state of the software at the customer site. Sometimes that is an unavoidable part of the job. When troubleshooting a system with patients' records, I can’t just ask the customer to schlep the data to my laptop so I can analyze it properly. Even if we could do that, there are a lot of cases that simply don’t reproduce anywhere but the live environment.

Part of the process of debugging an issue in a production environment is to be able to gather enough information on site that we can draw the appropriate conclusions from. RavenDB comes with a lot of tools to do just that. One of the most useful of those tools is the idea of the debug package. That is a simple idea, in the end. It gathers all the information we have about our system and packages that into a zip file. That zip file contains a lot of metrics, but it doesn’t contain customer data (aside from databases & index names, which are usually not sensitive).

There have been several separate cases recently where we were able to use the debug package to analyze what is going on and came back to the customer with answers. However, when hearing our explanations about what was the root cause of  the issue, the customer rejected our hypothesis.

In one case, a customer was worried about the load that they were observing in their system. Not because there was an issue, but the number of requests that they observed was higher than was expected. The customer switched to using concurrent subscriptions recently and deployed a couple of worker nodes to spread the load of processing documents. However, the number of requests observed was far higher than they expected. Whereas before they had a single worker per subscription, and a known amount of work that they could easily measure, after switching to concurrent subscriptions they observed a big increase in the number of requests processed by RavenDB.

Given that they deployed their subscriptions to two workers, initially, it was expected that the amount of work that the cluster is processing would double. Instead, it was increased by tenfold. Looking at the metrics in the debug package, we could see that they had 10 instances of each subscription running, but the customer was insistent that they only deployed two workers nodes.

Our metrics said that there were 5 subscriptions from IP-1 and 5 subscriptions from IP-2. After some back and forth it was revealed that everyone was correct, but talking past each other. The customer deployed two worker nodes, yes. But each of those spawned 5 instances of the subscriptions to take advantage of concurrency inside the same worker node.

In the second case, we have a customer that noticed a marked increase in the amount of bandwidth that they were using. They traced that additional bandwidth to the internal communication between the nodes in the cluster. Given that they are running in the cloud, they were (rightly) concerned about the sudden jump in the bandwidth. We started the investigation process and… we didn’t like what we saw. The cluster had gone through three full node rebuilds in the past month. At least, that was what the data was telling us. But that didn’t make much sense.

Quite concerned that there is something really bad going on, we talked to the customer, who thought about this for a while, checked their own logs and explained what was going on. They are running on Lsv2-series Azure instances, and apparently, within the space of a few weeks, all three of their instances had been moved to another physical host. The Lsv2-series instances use local ephemeral NVMe drives. When they moved an instance between hosts, the effect was as if we were given a brand new hard disk. RavenDB was able to handle that scenario more or less seamlessly, with the other nodes in the cluster filling in for the down node and sending it all the data it lost. The effect of that, of course, was a big jump in network bandwidth while that was going on.

The customer wasn’t actually aware that this happened until they looked at the logs, RavenDB had it handled, and it was only noticed because of the bandwidth spike.

The point of this post isn’t to talk about how awesome RavenDB is (even if I do think it is pretty awesome). Nor is it to extoll how good our support team is at figuring out things about the customer setup that even the customer isn’t aware of.

The point of this post is that you have to take into account, quite clearly, that the details that the customer is providing may be outdated, wrong or just misleading. Not because of any malicious intention on their end, but because they give you the information they have, not what is actually going on.

It reminds me of an old trick in tech support: “Take the plug out of the socket, blow on both the socket and the plug, then insert it again”. The point isn’t to blow whatever dust may have been there, preventing good contact. The point is to ensure that the silly thing is actually plugged in, but you can’t ask if this is plugged in, because the person on the other side of the call would say: “Of course it is” and never check.

time to read 3 min | 595 words

RavenDB introduced a TCP compression feature in version 5.3. The idea is that all internal communication in the cluster (as well as subscriptions), will use the Zstd compression format to reduce the overall bandwidth utilization by RavenDB. We have always supported HTTP compression, and that closed the circle.

The fact hat we are using Zstd means that we have a higher compression ratio and less CPU usage, so everyone was happy.  Except… sometimes, they weren’t.

In some cases, we noticed that there would be network failures at a far higher rate than previous experienced. RavenDB is robust to network errors, so that was handled, but that is still a concern. We figured out that the problem was rooted in the compression code. If we enabled compression between the systems, it would have far higher rate of failures than otherwise. But only when running in secured mode, when the system is running without security, everything works.

My first suspicion is that something is in the network, monitoring it. But the whole point of secured mode is that no one can peek into the stream not interfere with the contents. Given that this is a self-healing issue, it took some time to dedicate the right amount of attention to it, but we managed to figure it out.

This is a confluence of three different features that all play together to get this to happen.

With compression, we typically do something like this:

That is pretty much how all compression stream will work. But we do have to consider the following issue, there may be no output.

When can that happen?

Let’s assume that I’m using the simplest compression algorithm (run length encoding).

In other words, it will take a buffer such as: aaaaaacccccccbbbb and turn that into a7c6b4.

Now, let’s consider what would be the output of such an algorithm if we pass it a buffer consisting of a single value?

It will only update its internal state, it will not output anything. That is fine, we need a call to Flush() to ensure that all the state is out.

That means that this will return an empty buffer, which we are then writing to the inner stream. And that is fine, right? Since writing a zero length buffer is a no-op.

Except that it isn’t a no-op. There is the concept of empty SSL records, mostly it seams to handle the BEAST attack. So when you pass an empty buffer to the SslStream, it will emit an empty record to the network.

Which is good, except that you may have a scenario where you emit a lot of those values. And it turns out that OpenSSL has a limit to how many consecutive empty records it will accept (under the assumption that it must move forward and produce output and not just loop).

So, in order to repeat this bug, we need:

  • Input that will result in zero output from the compressor (fully repeating previous values, usually). Resulting in a zero length buffer as the output of the compression.
  • Sending the empty SSL record over the stream.
  • Repeating this for 32 times.

When all three conditions are satisfied, we get an error on the receiving end and the connection is broken. That means that the next call will have a different compression state and likely won’t have a problem at the same location.

In short, this is fun exercise in seeing how three different design decisions, all of whom are eminently reasonable, result in a very hard to trace bug.

The good thing is that this is simplicity itself to solve. We just need to avoid writing zero length buffer to the stream.

time to read 4 min | 641 words

We got a call from a customer, a pretty serious one. RavenDB is used to compute billing charges for customers. The problem was that in one of their instances, the value for a particular customer was wrong. What was worse was that it was wrong on just one instance of the cluster. So the customer would see different values in different locations. We take such things very seriously, so we started an investigation.

Let me walk you through reproducing this issue, we have three collections (Users, Credits and Charges):

image

The user is performing actions in the system, which issue charges. This is balanced by the Credits in the system for the user (payment they made). There is no 1:1 mapping between charges and credits, usually.

Here is an example of the data:

image

And now, let’s look at the index in question:

This is a multi map-reduce index that aggregates data from all three collections. Now, let’s run a query:

image

This is… wrong. The charges & credits should be more or less aligned. What is going on?

RavenDB has a feature called Map Reduce Visualizer, to help work with such scenarios, let’s see what this tells us, shall we?

image

What do we see in this image?

You can see that we have two results for the index. Look at Page #854 (at the top), we have one result with –67,343 and another with +67,329. The second result also does not have an Id property or a Name property.

What is going on?

It is important to understand that the image that we have here represents the physical layout of the data on disk. We run the maps of the documents, and then we run the reduce on each page individually, and sum them up again. This approach allows us to handle even a vast amount of data with ease.

Look at what we have in Page #540. We have two types of documents there, the users/ayende document and the charges documents. Indeed, at the top of Page #540 we can see the result of reducing all the results in the page. The data looks correct.

However…

Look at Page #865, what is going on there? Looks like we have most of the credits there. Most importantly, we don’t have the users/ayende document there. Let’s take a look at the reduce definition we have:

What would happen when we execute it on the results in Page #865? Well, there is no entry with the Name property there. So there is no Name, but there is also no Id. But we project this out to the next stage.

When we are going to reduce the data again among all the entries in Page #854 (the root one), we’ll group by the Id property, but the Id property from the different pages is different. So we get two separate results here.

The issue is that the reduce function isn’t recursive, it assumes that in all invocations, it will have a document with the Name property. That isn’t valid, since RavenDB is free to shuffle the deck in the reduce process. The index should be robust to reducing the data multiple times.

Indeed, that is why we had different outputs on different nodes, since we don’t guarantee that will process results in the same order, only that the output should be identical, if the reduce function is correct. Here is the fixed version:

And the query is now showing the correct results:

image

That is much better Smile

FUTURE POSTS

  1. RavenDB and Gen AI Security - 3 days from now
  2. RavenDB & Distributed Debugging - 6 days from now
  3. RavenDB & Ansible - 11 days from now

There are posts all the way to Jul 22, 2025

RECENT SERIES

  1. RavenDB 7.1 (7):
    11 Jul 2025 - The Gen AI release
  2. Production postmorterm (2):
    11 Jun 2025 - The rookie server's untimely promotion
  3. Webinar (7):
    05 Jun 2025 - Think inside the database
  4. Recording (16):
    29 May 2025 - RavenDB's Upcoming Optimizations Deep Dive
  5. RavenDB News (2):
    02 May 2025 - May 2025
View all series

Syndication

Main feed ... ...
Comments feed   ... ...
}