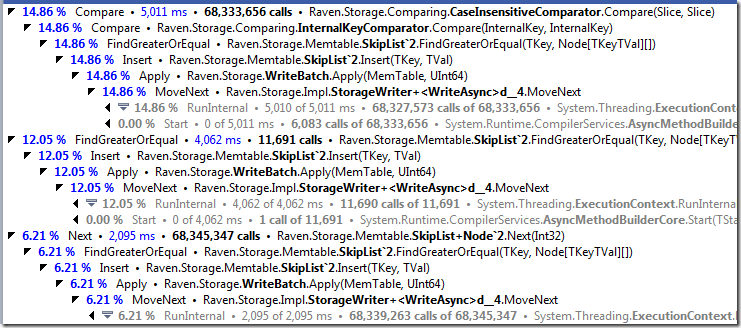
So, we have a perf problem in the managed leveldb implementation. I pulled out dotTrace and looked at the numbers:
Do you see where the problem is?
So, we have a perf problem in the managed leveldb implementation. I pulled out dotTrace and looked at the numbers:
Do you see where the problem is?
So, here I am writing some really fun code, when I found out that I am running into dead locks in the code. I activate emergency protocols and went into deep debugging mode.
After being really through in figuring out several possible causes, I was still left with what is effectively a WTF @!(*!@ DAMN !(@*#!@* YOU !@*!@( outburst and a sudden longing for something to repeatedly hit.
Eventually, however, I figure out what was going on.
I have the following method: Aggregator.AggregateAsync(), inside which we have a call to the PulseAll method. That method will then go and execute the following code:
1: public void PulseAll()2: {
3: Interlocked.Increment(ref state);4: TaskCompletionSource<object> result;5: while (waiters.TryDequeue(out result))6: {
7: result.SetResult(null);8: }
9: }
After that, I return from the method. In another piece of the code (Aggregator.Dispose) I am waiting for the task that is running the AggregateAsync method to complete.
Nothing worked! It took me a while before I figured out that I wanted to check the stack, where I found this:
Basically, I had a dead lock because when I called SetResult on the completion source (which freed the Dispose code to run), I actually switched over to that task and allowed it to run. Still in the same thread, but in a different task, I run through the rest of the code and eventually got to the Aggregator.Dispose(). Now, I could only get to it if it the PulseAll() method was called. But, because we are on the same thread, that task hasn’t been completed yet!
In the end, I “solved” that by introducing a DisposeAsync() method, which allowed us to yield the thread, and then the AggregateAsync task was completed, and then we could move on.
But I am really not very happy about this. Any ideas about proper way to handle async & IDisposable?
As I mentioned, I run into a very nasty issue with the TPL. I am not sure if it is me doing things wrong, or an actual issue.
Let us look at the code, shall we?
We start with a very simple code:
1: public class AsyncEvent2: {
3: private volatile TaskCompletionSource<object> tcs = new TaskCompletionSource<object>();4:
5: public Task WaitAsync()6: {
7: return tcs.Task;8: }
9:
10: public void PulseAll()11: {
12: var taskCompletionSource = tcs;
13: tcs = new TaskCompletionSource<object>();14: taskCompletionSource.SetResult(null);15: }
16: }
This is effectively an auto reset event. All the waiters will be released when the PulseAll it called. Then we have this runner, which just execute work:
1: public class Runner : IDisposable2: {
3: private readonly ConcurrentQueue<TaskCompletionSource<object>> items =4: new ConcurrentQueue<TaskCompletionSource<object>>();5: private readonly Task<Task> _bg;6: private readonly AsyncEvent _event = new AsyncEvent();7: private volatile bool _done;8:
9: public Runner()10: {
11: _bg = Task.Factory.StartNew(() => Background());
12: }
13:
14: private async Task Background()15: {
16: while (_done == false)17: {
18: TaskCompletionSource<object> result;19: if (items.TryDequeue(out result) == false)20: {
21: await _event.WaitAsync();
22: continue;23: }
24:
25: //work here, note that we do NOT use await!26:
27: result.SetResult(null);28: }
29: }
30:
31: public Task AddWork()32: {
33: var tcs = new TaskCompletionSource<object>();34: items.Enqueue(tcs);
35:
36: _event.PulseAll();
37:
38: return tcs.Task;39: }
40:
41: public void Dispose()42: {
43: _done = true;44: _event.PulseAll();
45: _bg.Wait();
46: }
47: }
And finally, the code that causes the problem:
1: public static async Task Run()2: {
3: using (var runner = new Runner())4: {
5: await runner.AddWork();
6: }
7: }
So far, it is all pretty innocent, I think you would agree. But this cause hangs with a dead lock. Here is why:
Because tasks can share threads, we are in the Background task thread, and we are trying to wait on that background task completion.
Result, deadlock.
If I add:
1: await Task.Yield();
Because that forces this method to be completed in another thread, but that looks more like something that you add after you discover the bug, to be honest.
The following code has very subtle bug:
1: public class AsyncQueue2: {
3: private readonly Queue<int> items = new Queue<int>();4: private volatile LinkedList<TaskCompletionSource<object>> waiters = new LinkedList<TaskCompletionSource<object>>();5:
6: public void Enqueue(int i)7: {
8: lock (items)9: {
10: items.Enqueue(i);
11: while (waiters.First != null)12: {
13: waiters.First.Value.TrySetResult(null);14: waiters.RemoveFirst();
15: }
16: }
17: }
18:
19: public async Task<IEnumerable<int>> DrainAsync()20: {
21: while (true)22: {
23: TaskCompletionSource<object> taskCompletionSource;24: lock (items)25: {
26: if (items.Count > 0)27: {
28: return YieldAllItems();29: }
30: taskCompletionSource = new TaskCompletionSource<object>();31: waiters.AddLast(taskCompletionSource);
32: }
33: await taskCompletionSource.Task;
34: }
35: }
36:
37: private IEnumerable<int> YieldAllItems()38: {
39: while (items.Count > 0)40: {
41: yield return items.Dequeue();42: }
43:
44: }
45: }
I’ll even give you a hint, try to run the following client code:
1: for (int i = 0; i < 1000 * 1000; i++)
2: {
3: q.Enqueue(i);
4: if (i%100 == 0)
5: {
6: Task.Factory.StartNew(async () =>
7: {
8: foreach (var result in await q.DrainAsync())
9: {
10: Console.WriteLine(result);
11: }
12: });
13: }
14:
15: }
We got a really nasty bug report from a user. Sometimes, out of the blue, RavenDB would throw an error:
System.InvalidOperationException: Collection was modified; enumeration operation may not execute.
at System.Collections.Generic.List`1.Enumerator.MoveNextRare()
at Raven.Json.Linq.RavenJArray.WriteTo(JsonWriter writer, JsonConverter[] converters) in c:\Builds\RavenDB-Stable\Raven.Abstractions\Json\Linq\RavenJArray.cs:line 174
at Raven.Json.Linq.RavenJObject.WriteTo(JsonWriter writer, JsonConverter[] converters) in c:\Builds\RavenDB-Stable\Raven.Abstractions\Json\Linq\RavenJObject.cs:line 275 at Raven.Json.Linq.RavenJObject.WriteTo(JsonWriter writer, JsonConverter[] converters) in c:\Builds\RavenDB-Stable\Raven.Abstractions\Json\Linq\RavenJObject.cs:line 275
Unfortunately, this error only happened once in a while, usually when the system was under load. But they weren’t able to provide a repro for that.
Luckily, they were able to tell us that they suspected that this is related to the replication support. I quickly setup a database with replication and wrote the following code to try to reproduce this:
using(var store = new DocumentStore { Url = "http://localhost:8080", DefaultDatabase = "hello" }.Initialize()) { using(var session = store.OpenSession()) { session.Store(new ReadingList { UserId = "test/1", Id = "lists/1", Books = new List<ReadingList.ReadBook>() }); session.SaveChanges(); } Parallel.For(0, 100, i => { while (true) { try { using (var session = store.OpenSession()) { session.Advanced.UseOptimisticConcurrency = true; session.Load<ReadingList>("lists/1") .Books.Add(new ReadingList.ReadBook { ReadAt = DateTime.Now, Title = "test " + i }); session.SaveChanges(); } break; } catch (ConcurrencyException) { } } }); }
And that reproduced the bug! Hurrah! Done deal, we can move on, right?
Except that the bug was only there when we have massive amount of threads hitting the db at once, and trying to figure out what is actually going on there was next to impossible using standard debugging tools. Instead, I reached down to my tracing toolbelt and starting pulling stuff out. First, we identified that the problem occurred when iterating over RavenJArray, which is our own object, so we added the following:
ConcurrentQueue<StackTrace> addStackTraces = new ConcurrentQueue<StackTrace>(); public void Add(RavenJToken token) { if (isSnapshot) throw new InvalidOperationException("Cannot modify a snapshot, this is probably a bug"); addStackTraces.Enqueue(new StackTrace(true)); Items.Add(token); }
And this one (where the exception is raised):
public override void WriteTo(JsonWriter writer, params JsonConverter[] converters) { writer.WriteStartArray(); if (Items != null) { try { foreach (var token in Items) { token.WriteTo(writer, converters); } } catch (InvalidOperationException e) { foreach (var stackTrace in addStackTraces) { Console.WriteLine(stackTrace); } throw; } } writer.WriteEndArray(); }
With the idea that we would actually be able to get what is going on there. By tracking down who added items to this particular instance, I hoped that I would be able to figure out why we have an instance that is shared among multiple threads.
When I had that, it was pretty easy to see that it was indeed the replication bundle that was causing the issue. The problem was that the replication bundle was modifying an inner array inside the document metadata. We protected the root properties of the metadata from concurrent modifications, and most of the time, it works just fine. But the problem was that now we had a bundle that was modifying a nested array, which wasn’t protected.
This is one of those bugs that are really hard to catch:
I was grateful that the user figured out the replication connection, because I already sat on that bug previously, and there was no way I could figure out what is going on unless I had the trace to point me to where the actual problem was.
In one of our production deployments, we occasionally get a complete server process crash. Investigating the event log, we have this:
Exception: System.InvalidOperationException
Message: Collection was modified; enumeration operation may not execute.
StackTrace: at System.Collections.Generic.Dictionary`2.KeyCollection.Enumerator.MoveNext()
at System.Web.Hosting.ObjectCacheHost.TrimCache(Int32 percent)
at System.Web.Hosting.HostingEnvironment.TrimCache(Int32 percent)
at System.Web.Hosting.ApplicationManager.TrimCaches(Int32 percent)
at System.Web.Hosting.CacheManager.CollectInfrequently(Int64 privateBytes)
at System.Web.Hosting.CacheManager.PBytesMonitorThread(Object state)
at System.Threading.ExecutionContext.Run(ExecutionContext executionContext, ContextCallback callback, Object state, Boolean ignoreSyncCtx)
at System.Threading._TimerCallback.PerformTimerCallback(Object state)
As you can see, this is a case of what appears to be a run of the mill race condition, translated to a process killing exception because it was thrown from a separate thread.
This thread, by the way, is the ASP.Net Cache cleanup thread, and we have no control whatsoever over that. To make things worse, this application doesn’t even use the ASP.NET Cache in any way shape or form.
Any ideas how to resolve this would be very welcome.
I am not sure how to call this issue, except maddening. For a simple repro, you can check this github repository.
The story is quite simple, let us assume that you need to send a set of values from the server to the client. For example, they might be tick values, or updates, or anything of this sort.
You can do this by keeping an HTTP connection open and sending data periodically. This is a well known technique and it works quite well. Except in Silverlight, where it works, but only if you put the appropriate Thread.Sleep() in crucial places.
Here is an example of the server behavior:
var listener = new HttpListener { Prefixes = {"http://+:8080/"} }; listener.Start(); while (true) { var ctx = listener.GetContext(); using (var writer = new StreamWriter(ctx.Response.OutputStream)) { writer.WriteLine("first\r\nsecond"); writer.Flush(); } Console.ReadKey(); }
In this case, note that we are explicitly flushing the response, then just wait. If you look at the actual network traffic, you can see that this will actually be sent, the connection will remain open, and we can actually send additional data as well.
But how do you consume such a thing in Silverlight?
var webRequest = (HttpWebRequest)WebRequestCreator.ClientHttp.Create(new Uri("http://localhost:8080/")); webRequest.AllowReadStreamBuffering = false; webRequest.Method = "GET"; Task.Factory.FromAsync<WebResponse>(webRequest.BeginGetResponse, webRequest.EndGetResponse, null) .ContinueWith(task => { var responseStream = task.Result.GetResponseStream(); ReadAsync(responseStream); });
We start by making sure that we disable read buffering, then we get the response and start reading from it. The read method is a bit complex, because is has to deal with partial response, but it should still be fairly obvious what is going on:
byte[] buffer = new byte[128]; private int posInBuffer; private void ReadAsync(Stream responseStream) { Task.Factory.FromAsync<int>( (callback, o) => responseStream.BeginRead(buffer, posInBuffer, buffer.Length - posInBuffer, callback, o), responseStream.EndRead, null) .ContinueWith(task => { var read = task.Result; if (read == 0) throw new EndOfStreamException(); // find \r\n in newly read range var startPos = 0; byte prev = 0; bool foundLines = false; for (int i = posInBuffer; i < posInBuffer + read; i++) { if (prev == '\r' && buffer[i] == '\n') { foundLines = true; // yeah, we found a line, let us give it to the users var data = Encoding.UTF8.GetString(buffer, startPos, i - 1 - startPos); startPos = i + 1; Dispatcher.BeginInvoke(() => { ServerResults.Text += data + Environment.NewLine; }); } prev = buffer[i]; } posInBuffer += read; if (startPos >= posInBuffer) // read to end { posInBuffer = 0; return; } if (foundLines == false) return; // move remaining to the start of buffer, then reset Array.Copy(buffer, startPos, buffer, 0, posInBuffer - startPos); posInBuffer -= startPos; }) .ContinueWith(task => { if (task.IsFaulted) return; ReadAsync(responseStream); }); }
While I am sure that you could find bugs in this code, that isn’t the crucial point.
If we run the server, then run the SL client, we could see that we get just one lousy byte, and that is it. Now, reading about this, it appears that in some versions of some browsers, you need to send 4KB of data to get the connection going. But that isn’t what I have observed. I tried sending 4KB+ of data, and I still saw the exact same behavior, we got called for the first byte, and nothing else.
Eventually, I boiled it down to the following non working example:
writer.WriteLine("first"); writer.Flush(); writer.WriteLine("second"); writer.Flush();
Versus this working example:
writer.WriteLine("first"); writer.Flush(); Thread.Sleep(50); writer.WriteLine("second"); writer.Flush();
Yes, you got it right, if I put the thread sleep in the server, I’ll get both values in the client. Without the Thread.Sleep, we get only the first byte. It seems like it isn’t an issue of size, but rather of time, and I am at an utter loss to explain what is going on.
Oh, and I am currently awake for 27 hours straight, most of them trying to figure out what the )(&#@!)(DASFPOJDA(FYQ@YREQPOIJFDQ#@R(AHFDS:OKJASPIFHDAPSYUDQ)(RE is going on.
I got some strange results when using concurrent collections, so I decided to try to track it down, and wrote the following code:
var count = ?; var list = new List<object>(count); var sp = Stopwatch.StartNew(); for (int i = 0; i < count; i++) { list.Add(new ConcurrentBag<int>()); } sp.Stop(); Console.WriteLine("{0} {2} items in {1:#,#;;0}ms = {3:#,#;;0}ms per item", sp.Elapsed, sp.ElapsedMilliseconds, count, sp.ElapsedMilliseconds / count);
And then I started to play with the numbers, and it is not good.
This is incredibly high number, you have to understand. Just to compare, List<int> takes 8 ms to create 100,000 items.
Let us see how it works when we use more of this.
Note the numbers, will you?
1,000 items in 37 ms, but 10,000 items? 2.3 seconds!
And doubling the amount took ten times as long?
And at this point, I stopped trying, because I didn’t have the patience.
Note that the other concurrent collection, ConcurrentStack, ConcurrentQueue and ConcurrentDictionary do not suffer from the same problem.
I contacted Microsoft about this, and this is already resolved in .NET 4.5. The underlying issue was that ThreadLocal, which ConcurrentBag uses, didn’t expect to have a lot of instances. That has been fixed, and now can run fairly fast.
There are posts all the way to May 14, 2025