Oren Eini

CEO of RavenDB

a NoSQL Open Source Document Database

Get in touch with me:

oren@ravendb.net +972 52-548-6969

Posts: 7,583
|
Comments: 51,214
Privacy Policy · Terms
filter by tags archive
time to read 3 min | 585 words

Note, this image was generate using Active Writer and represnt a domain model similar to a project I am currently working on. I spared you the prolifieration of DateTime in the model and merely put it in three or four places just to show what it was in general.

(continued below)

(Image from clipboard).png

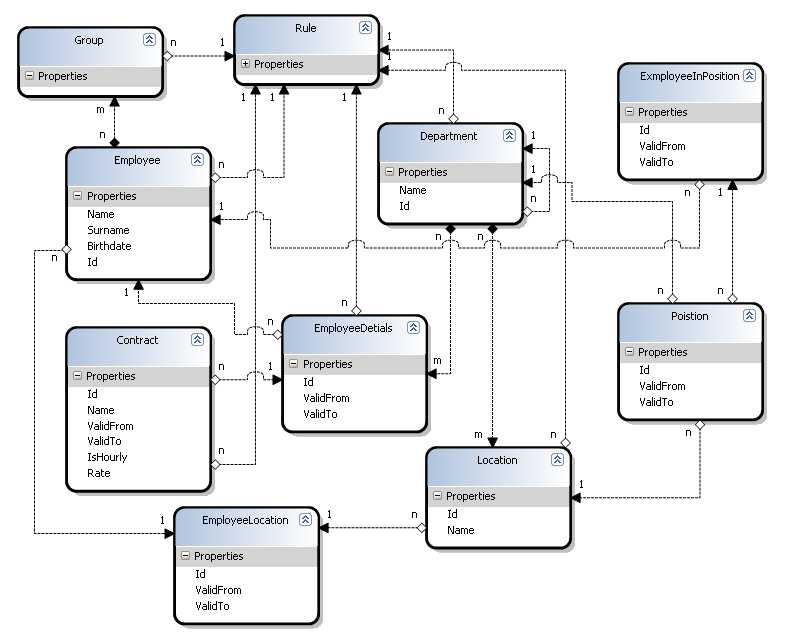
Now, this model is not showing unrelevant additonal entities (and entities attributes) but it is complete enough that you would understand the general theme of things. The requirement is finding all potential employees in the roganization for a specific vacant position.

Finding an employee consists of (with an implict "as of DD/MM/YYYY date" appended to each statement).

  • Finding all the employees that are in the Position's Location at those date ranges.
  • For each of those, verify that there isn't any rule broken if I position them there, discard those that break rules with high severity.
  • For each of the remaining ones, display how many other employees in each of the employee's group are positioned in the same department, per each group the employee belongs to.

A typical output should be something like:

For poistion Manager in Mainframe Division:

  • John Brane - Everyone: 9, MainFrame Guys - 3, Managers - 0
  • Mariah G. - Everyone: 9, Managers - 0, Has MBAs - 2

Rules, as you can see in the diagram, are attached to pratcially everything, and they are inheritable to the N-th degree.

So, in order to verify that an employee positioned in a certain Position, I need to gather the following rules:

  • Emloyee's current rules
  • > All of the Groups the employee belongs to rules
  • > All the location's rules
  • > All the department (and all their hierarcies) rules
  • Strip duplicate rules, using first come win approach. {duplicate rule is indicated by a rule type enum field}

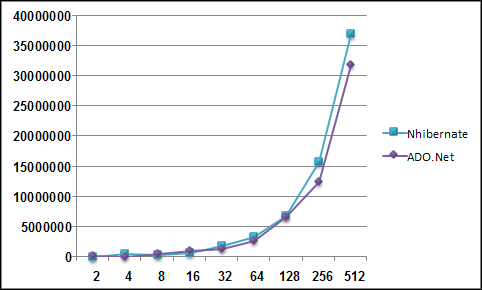
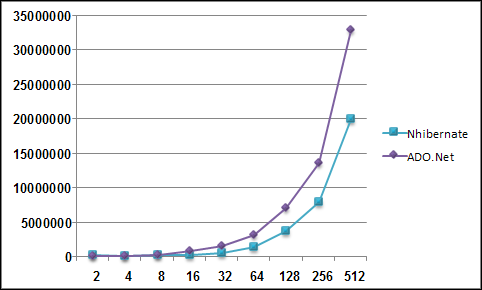
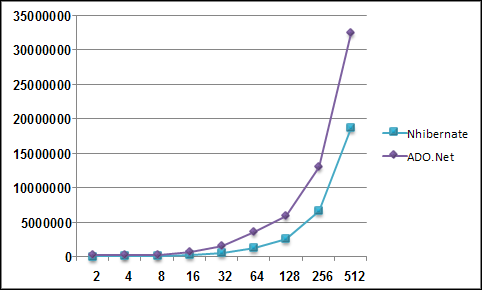
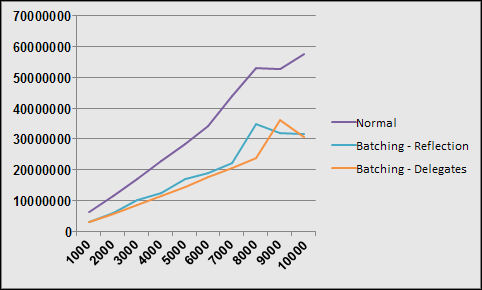
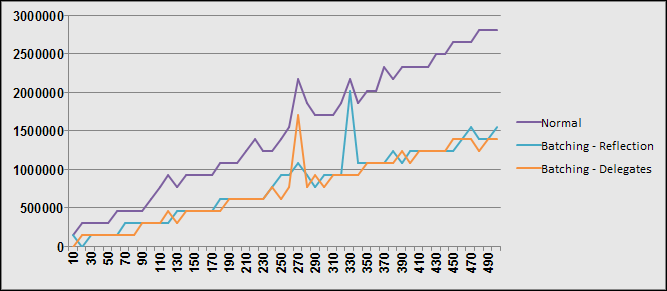
That is per employee. And then I need actually run the rules, and a rule may need additional data (employee's other positions, past history, etc). Oh, and this really better be done on the fly. This is the issue that I am talking about here, which used to take positive infinity or more to run.

At the moment it is 01:17 AM here, so I'm going to leave the question open. How are you going to handle this case? Assuming that everything is mapped using NHibernate and you got full freedom to handle this any way you want. I'm going to see if anyone can come up with an interesting suggestion before I post how I handled this situation tomorrow.

time to read 4 min | 700 words

I have a piece of code that has to calculate some pretty hefty stuff over a large amount of data. Unfortantely, that large amount of data took large amount of time to load. By large amount I mean, I walked away and had time for a coffee, chit chat, about three phone calls and a relaxing bout of head banging, and it still continued to pry into the database, and likely would continue to do so until the end of time or there about.

This calculation has two main charactaristics:

  1. It is vital to several core functions of the system.
  2. It is very highly preferred to make this calculation on the fly. Doing it on the backend is possible, but will cause a lot of major complications.

So, in the middle of checking the price of a dozen new servers (and a safe place in Nigeria, once the client hear about this), it occur to me that while pre-mature optimization is evil, maybe optimization itself has some value and that Nigeria might have to wait for another day.

After carefully thinking about the scentific process (i.e: observing the occurances, forming a theory, preparing experiments, proving a theory, arguing for a decade about what it means, etc...) I decided to take a more direct approach and looked at what I was trying to do.

Then I added this to the query:

left

join fetch e.Rules rules

And I re-run the whole thing. The performance benefit was four orders of magnitude. And by that I mean that the page is still very heavy DB wise (around ~50 queries on empty cache, which is my usual benchmark), it actually complete in real time, and all the rest of that stuff are things that are very easy to solve (grab those three pieces of code in one shot, instead of five, etc).

Of course, I then had to spend about half an hour staring at the generated query and think about what it was doing (there was a CROSS JOIN there that scared me) before coming to the conclution that it really was a good to fetch all that data. Well, almost. There should have been around ~6000 rows returned from this query, but only 2 were returned.

After a long bout of head scratching, I determained that the fault was at my mapping. I had several places where I had where clauses like this one:

where="Cancelled = 0"

I'm pretty sure that you can see where this is going. In a left join scenario, this (non-nullable) column is going to be null, so it would evaluate to false, making the join into an inner join, reducing the returned data by quite a bit. I'm writing this post as I go along fixing this issue. Right now the situation is not much improved :-(

After a long and hard battle, I managed to drop it merely three order of magnitude down, and I run into some issues with the code that uses it, so I need to fix those first.

I'll try to post some ideas about how to solve the complex SELECT N+(M*N*Zm)+1 issues (where N is the number of items, M is the number of collections in each item, and Zm is the number of items in each collection in each item). (The short version, don't do this.)

time to read 3 min | 517 words

As of about 90 minutes ago, NHibernate has batching support. :-D

All the tests are green, but there may be things that broke in exciting ways, so I encourage you to try it out and see if you can break it. This functionality exists only for SQL Server, and only on .Net 2.0 (for complaints, go directly to the ADO.Net team).

You can enable this functionality by adding this to your hibernate configuration.

<

add key="hibernate.batch_size" value="10" />

Setting this size to very large number and treating NHibernate as an OO tool for bulk inserts is still not recommended.

My previous tests showed about 50% performance benefits over normal calls, I decided to try to take the new code for a speed using NHibernate's perf tests. They are fairly simple, but they are at least an indication of what is going on. The tests I run were all run against a local instance of SQL Server, with log level set to WARN. The test just compare similar operations using NHibernate and direct ADO.Net for some operations, usually inserts / deletes in increasing amounts. (For reference, I'm running the Simultanous() test from PerformanceTest fixture).

I should also mention that these are by no mean real benchmarks, it is more in the way of an indication.

With no batching:

(Image from clipboard).png

As you can see, there isn't much of a performance difference between the two, NHibernate has about 15% overhead, mostly it can be seen as a background noise, especially on the lower ranges.

Let us try with a batching of 25, shall we?

(Image from clipboard).png

Now the roles are reversed, and it is NHibernate that is faster. In fact, in this benchmark, it was on average faster by 25% - 30% than the direct ADO.Net code (without batching). Just for kicks, I run the benchmark with batch size of 256, and got about 30% - 45% improvements.

(Image from clipboard).png

All in all, I think that I like this :-D

As a side note, most of the performance in an ORM is not in the INSERT / UPDATE / DELETE side of things, but rather in how smart the engine in SELECTing the data. Issuing a thousands unnececary SELECTs is going to be a performance hog no matter what you do.
time to read 3 min | 439 words

Joel wrote about Ruby's performance, and DHH replied with a post showing how he outsourcedhe performance-intensive functions. To note, my only experiance in Ruby is writing very few Watir tests. So I can't really say anything about Ruby's perfomance first hand. I agree with DHH that this is a good thing, but I wonder about how to handle this in situations where the performance critical part is something that is core to the business logic.

I'm not talking about general stuff like image resizing, encryption or bayesian filtering (which I think you are crazy if you are writing your own for production). What I am talking about is that an application that is not mostly data entry and pre-calculated reports (a good example of which is a bug tracking system).

Let us assume a package delivery application, which let the user choose the route that they can send their packages, of the top of my head, you need to calculate cost (time & money) of moving the package each route while taking into account service level agreements, legal responsabilities, contract issues, past history,  validity dates, etc. This get complex very fast, and the amount of data that you need to consider is fairly big, especially if you need to consider business rules like (if customer send more than 10 package a month for the last 3 months, give 4% off, etc).

You can do this on the backend, to pre-calculate the most common ( or all ) routes and their costs, but it may very well be that you simply have too much parameters to do this pre-calculation (or are prevent for business reasons).

Assuming that I had a web application in Ruby on Rails, and I wanted to make the choose a route page work, how would I go about building it? This is mainly a CPU bound task, with a limited amount of data to fetch and process, but I can't easily drop down to C for this task. This is a task that involve quite a bit of business logic (just finding out if a contract is valid or not may be a complex process, for instance), which I would have to duplicate in C (I may be able to hand the data to the C program from Ruby in a usable form, but I doubt it) in order to gain the neccecary performance.

So, given this scenario (and, of course, assuming that doing this in Ruby is not performant enough), what are the options that I have?

time to read 4 min | 660 words

After last night's post about the performance benefits of SqlCommandSet, I decided to give the ADO.Net team some headache, and release the results in a reusable form.

The relevant code can be found here, as part of Rhino Commons. Beside exposing the batching functionality, it is very elegant (if I say so myself) way of exposing functionality that the original author decided to mark private / internal.

I really liked the declaration of this as well:

[

ThereBeDragons("Not supported by Microsoft, but has major performance boost")]
public class SqlCommandSet : IDisposable

The usage is very simple:

SqlCommandSet commandSet = new SqlCommandSet();

commandSet.Connection = connection;

for (int i = 0; i < iterations; i++)

{

       SqlCommand cmd = CreateCommand(connection);

       commandSet.Append(cmd);

}

int totalRowCount = commandSet.ExecuteNonQuery();

As a note, I spiked a little test of adding this capability to NHibernate, and it seems to be mostly working, I got 4 (out of 694) test failing because of this. I didn't check performance yet.

time to read 3 min | 490 words

I have ranted before about the annoying trend from Microsoft, to weld the hood shut in most of the interesting places. One particulary painful piece is the command batching implementation in .Net 2.0 for SQL Server. The is extremely annoying mainly because the implementation benefits are going for those who are going to be using DataSets (ahem, not me), but are not avialable to anyone outside of Microsoft. (See topic: OR/M, NHibernate, etc).

Today, I have decided to actually check what the performance difference are all about. In order to do this, I opened the (wonderful, amazing) Reflector and started digging. To my surprise, I found that the Batching implementation seems to be centralized around a single class, System.Data.SqlClient.SqlCommandSet (which is internal, of course, to prevent it from being, you know, useful).

Since the class, and all its methods, are internal to System.Data, I had to use Reflection to pry them out into the open. I noticed that the cost of reflection was fairly high, so I converted the test to use delegates, which significantly imporved perfromance. The query I run was a very simple query:

INSERT

INTO [Test].[dbo].[Blogs] ([blog_name]) VALUES (@name)

With the @name = 'foo' as the parameter value. The table is simple Id (identity), Blog_Name (nvarchar(50))

Note: Before each test, I truncated the table, to make sure it is not the additional data that is causing any slowdown.

The Results:

(Image from clipboard).png

The X axis is the number of inserts made, the Y axis is the number of ticks that the operation took. As you can see, there is quite a performance difference, even for small batch sizes. There is a significant difference between batching and not batching, and that reflection / delegates calls are not a big cost in this scenario.

Here is the cost of a smaller batch:

(Image from clipboard).png

This shows a significant improvement even for a more real-world loads, even when we use Reflection. 

I just may take advantage of this to implement a BatchingBatcher for NHibernate, it looks like it can make a good benefit for perfromance. Although this will probably not affect SELECT performance, which is usually a bigger issue.

You can get the code here: BatchingPerfTest.txt

time to read 10 min | 1984 words


One of the biggest problems with abstractions is that they may allow you to do stupid things without them being obvious. In OR/M-land, that usually means SELECT N+1 issues.
The problem is that you often develop a certain functionality first, and only then realize that while you tested, all was fine and dandy on the five items that you had, but on the real system, you have 5,000, and the DBA is on its way to ER...

Anyway, I am currently working with Web Applications, and I wanted to get a good indication about what pages are troublesome.
Being who I am, I immediately began to design a framework that would correlate page requests to trace data from SQL Server, and then another system that would analyze it and spit out a report saying: "Wow, that ScaryReport.aspx page is making 30% of the calls in the application, take a look at that".

Not wishing to spent the next two years on this project, I decided to do something a bit more modest, and utilize the already existing infrastructure.
In this case ,the infrastructure is NHibernate and lot4net.

The secret tidbit is that NHibernate logs all queries to a log4net logger named "NHibernate.SQL". From there, it was a simple matter of adding a logging helpers to Rhino Commons that would output the current page and the current request id (the request hash code, basically).
Then, It was a matter of defining the following table:

CREATE TABLE [dbo].[NHibernatePerPageQueries](
   
[Id] [int] IDENTITY(1,1) PRIMARY KEY NOT NULL,
   
[RequestId] [int] NOT NULL,
   
[Date] [datetime] NOT NULL,
   
[Message] [nvarchar](max)  NOT NULL,
   
[PageURL] [nvarchar](max)  NOT NULL
)


Then, to define the appender:

<appender name="NHibernatePerPageAppender"
            
type="log4net.Appender.AdoNetAppender">
    
<
bufferSize value="10" />
    
<
connectionType value="System.Data.SqlClient.SqlConnection,
System.Data, Version=2.0.0.0, Culture=neutral,
PublicKeyToken=b77a5c561934e089
" />
    
<
connectionString value="Data Source=localhost;Initial
Catalog=Logs;User ID=logger;Password=logger;
" />
    
<
commandText value="INSERT INTO dbo.[NHibernatePerPageQueries]
([Date],[Message],[PageUrl],[RequestId]) VALUES (@log_date, @message,
@pageUrl,@currentRequestId)
" />
    
<
parameter>
           <
parameterName value="@log_date" />
          
<
dbType value="DateTime" />
          
<
layout type="log4net.Layout.RawTimeStampLayout" />
    
</
parameter>
     <
parameter>
           <
parameterName value="@message" />
          
<
dbType value="String" />
          
<
size value="4000" />
          
<
layout type="log4net.Layout.PatternLayout">
               
<
conversionPattern value="%message" />
          
</
layout>
     </
parameter>
     <
parameter>
           <
parameterName value="@pageUrl" />
          
<
dbType value="String" />
          
<
size value="2000" />
          
<
layout type="log4net.Layout.PatternLayout">
               
<
conversionPattern value="%property{nhibernate_page_url}" />
          
</
layout>
     </
parameter>
     <
parameter>
           <
parameterName value="@currentRequestId" />
          
<
dbType value="String" />
          
<
size value="2000" />
          
<
layout type="log4net.Layout.PatternLayout">
               
<
conversionPattern value="%property{current_request_id}" />
          
</
layout>
     </
parameter>
</
appender>


And defining the logger:

<logger name="NHibernate.SQL">
    
<
level value="DEBUG" />
    
<
appender-ref ref="NHibernatePerPageAppender" />
</
logger>


We are still not done, though, we need the following in the Application_Start():

GlobalContext.Properties["nhibernate_page_url"] = WebLoggingHelper.CurrentPage;
GlobalContext
.Properties["current_request_id"] = WebLoggingHelper.CurrentRequestId;


This is it, now I can correlate the number of queries per page hits, and act accordingly.
Normally, I think that the following queries should be enough:

-- Get pages ordered by number of total queries made from them

SELECT COUNT(*) [Number Of Queries In Page], PageUrl
FROM
NHibernatePerPageQueries
WHERE
substring(Message,1,1) != '@' -- remove parameters logs
GROUP
BY PageUrl ORDER BY COUNT(*)


-- Get pages ordered by number of queries per page

SELECT AVG(countOfQueries) [Number Of Queries In Page Per Request], PageUrl FROM (
    
SELECT COUNT(*) countOfQueries, PageUrl
     FROM NHibernatePerPageQueries
     WHERE substring(Message,1,1) != '@' -- remove parameters logs
    
GROUP BY PageUrl, RequestId ) innerQuery
GROUP
BY PageUrl ORDER BY AVG(countOfQueries)


Enjoy,
time to read 10 min | 1834 words


I just added a small http module to Rhino Commons. It is a very simple module that times how long it takes to process a page.
It only times the server-side processing, of course, but it is a great way to tell you where you need to pay attention.
It is using log4net to log the data, so you can redirect the output to a database, and from there, you can get all the data you want.

Configurating the module is very simple. Create the following table:

CREATE TABLE [dbo].[PagePerformance](
    
[Id] [int] PRIMARY KEY IDENTITY(1,1) NOT NULL,
    
[Date] [datetime] NOT NULL,
    
[Message] [nvarchar](max) NOT NULL,
    
[PageURL] [nvarchar](max) NOT NULL,
    
[Duration] [nvarchar](50) NOT NULL,
    
[StartRequest] [datetime] NOT NULL
)

Now, add the following to your <httpModules> tag in web.config:

<httpModules>
     <
add name="PagePerformanceModule"
          
type="Rhino.Commons.HttpModules.PagePerformanceModule"/>
</
httpModules>


Finally, we define in log4net.config the appender configuration:

<appender name="PagePerfAppender"
            
type="log4net.Appender.AdoNetAppender">
    
<
bufferSize value="10" />
    
<
connectionType value="System.Data.SqlClient.SqlConnection,
System.Data, Version=2.0.0.0, Culture=neutral, PublicKeyToken=b77a5c561934e089
" />
    
<
connectionString value="Data Source=localhost;Initial
Catalog=Logs;User ID=logger;Password=logger;
" />
    
<
commandText value="INSERT INTO dbo.PagePerformance
([Date],[Message],[PageUrl],[Duration],[StartRequest]) VALUES (@log_date, @message, @pageUrl, @duration, @startRequest)
" />
    
<
parameter>
           <
parameterName value="@log_date" />
          
<
dbType value="DateTime" />
          
<
layout type="log4net.Layout.RawTimeStampLayout" />
    
</
parameter>
     <
parameter>
           <
parameterName value="@message" />
          
<
dbType value="String" />
          
<
size value="4000" />
          
<
layout type="log4net.Layout.PatternLayout">
               
<
conversionPattern value="%message" />
          
</
layout>
     </
parameter>
     <
parameter>
           <
parameterName value="@pageUrl" />
          
<
dbType value="String" />
          
<
size value="2000" />
          
<
layout type="log4net.Layout.PatternLayout">
               
<
conversionPattern value="%property{page_url}" />
          
</
layout>
    
</
parameter>
     <
parameter>
           <
parameterName value="@duration" />
          
<
dbType value="String" />
          
<
size value="50" />
          
<
layout type="log4net.Layout.PatternLayout">
               
<
conversionPattern value="%property{page_duration}" />
          
</
layout>
     </
parameter>
     <
parameter>
           <
parameterName value="@StartRequest" />
          
<
dbType value="DateTime" />
           
<
layout type="log4net.Layout.PatternLayout">
               
<
conversionPattern value="%property{start_request}" />
          
</
layout>
     </
parameter>
</
appender>

The page_duration, start_request and page_url properties are added to log4net configuration by the http module.
Then, all that is left is defining the logger itself:

<logger name="Rhino.Commons.HttpModules.PagePerformanceModule">
    
<
level value="DEBUG" />
    
<
appender-ref ref="PagePerfAppender" />
</
logger>

If everything went well, you have now got yourself a table in the DB that measures
how much it takes to serve each page.

Note: There is a small buffer (10 page requests) defined, to reduce the cost of the logging, so you would need to hit refresh a couple of time before you see the results in the table.

FUTURE POSTS

No future posts left, oh my!

RECENT SERIES

  1. Production postmorterm (2):
    11 Jun 2025 - The rookie server's untimely promotion
  2. Webinar (7):
    05 Jun 2025 - Think inside the database
  3. Recording (16):
    29 May 2025 - RavenDB's Upcoming Optimizations Deep Dive
  4. RavenDB News (2):
    02 May 2025 - May 2025
  5. Production Postmortem (52):
    07 Apr 2025 - The race condition in the interlock
View all series

Syndication

Main feed ... ...
Comments feed   ... ...
}