RavenDB 5.0Exploring Time Series–Part I
RavenDB 5.0 is coming soon and the big new there is time series support. We have gotten to the point where we can actually show off what we can do, which makes me very happy. You can use the nightlies builds to explore time series support in RavenDB 5.0. Client side packages for 5.0 are also available.
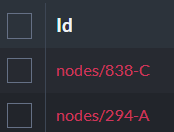
I went ahead and created a new database and created some documents:
Time series are often used for monitoring, so I decided to go with the flow and see what kind of information we would want to store there. Here is how we can add some time series data to the documents:
I want to focus on this for a bit, because it is important. A time series in RavenDB has the following details:
- The timestamp to associate to the values – in the code above, this is the current time (UTC)
- The tag associated with the timestamp – in the code above, we record what devices and interfaces these measurements belong to.
- The measurements themselves – RavenDB allows you to record multiple values for a single timestamp. We threat them as an array of values, and you can chose to put them in a single time series or to split them.
Let’s assume that we have quite a few measurements like this and that we want to look at the data. You can explore things in the Studio, like so:
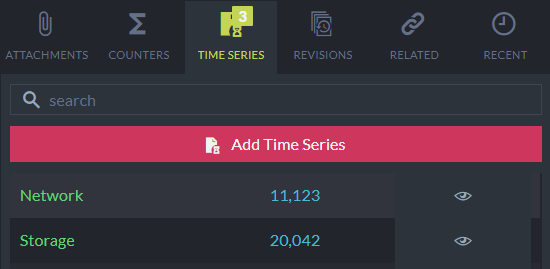
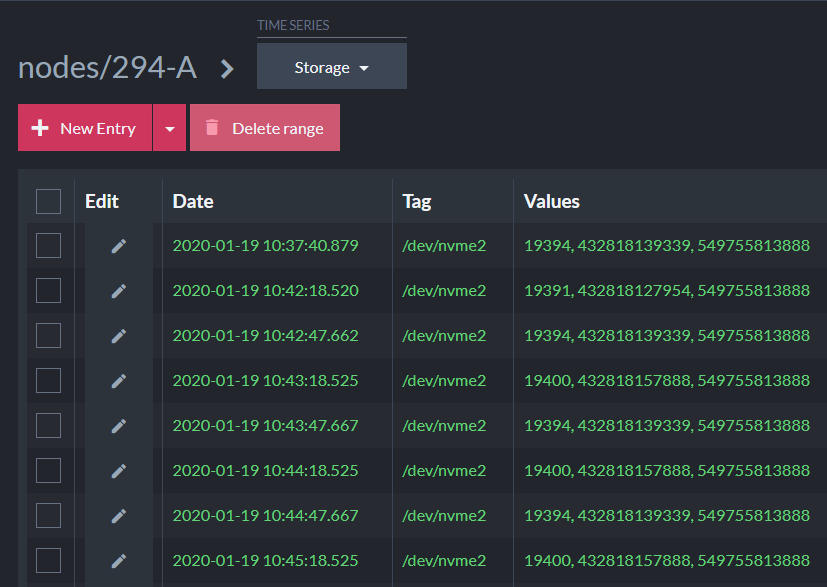
We have another tab in the Studio that you can look at which will give you some high level details about the timeseries for a particular document. We can dig deeper, too, and see the actual values:
You can also query the data to see the patterns and not just the individual values:
The output will look like this:
And you can click on the eye to get more details in chart form. You can see a little bit of this here, but it is hard to do it justice with a small screen shot:
Here is what the data you get back from this query:
The ability to store and process time series data is very important for monitoring, IoT and healthcare systems. RavenDB is able to do quite well in these areas. For example, to aggregate over 11.7 million heartrate details over 6 years at a weekly resolution takes less than 50 ms.
We have tested timeseries that contained over 150 million entries and we can aggregate results back over the entire data set in under three seconds. That is a nice number, but it doesn’t match what dedicated time series databases can do. It represents a rate of about 65 million rows / second. ScyllaDB recently published a benchmark in which they talk about billion rows / sec. But they did that on 83 nodes, so they did just 12 million / sec per node. Less than a fifth of RavenDB’s speed.
But that is being unfair, to be honest. While timeseries queries are really interesting, we don’t really expect users to query very large amount of data using raw queries. That is what we have indexes for, after all. I’m going to talk about this in depth in my next post.
More posts in "RavenDB 5.0" series:
- (20 Mar 2020) Optimizing date range queries
- (21 Jan 2020) Exploring Time Series–Part II
- (20 Jan 2020) Exploring Time Series–Part I


Comments
Comment preview