Oren Eini

CEO of RavenDB

a NoSQL Open Source Document Database

Get in touch with me:

oren@ravendb.net +972 52-548-6969

Posts: 7,590
|
Comments: 51,218
Privacy Policy · Terms
filter by tags archive
time to read 2 min | 301 words

For a long time, most of the work in the profiler (NH Prof, HProf, L2S Prof & EF Prof) could be done only with the use of the mouse. That annoyed a bunch of people, but it didn’t really bother me.  Rob fixed this recently, and I cannot believe what kind of a difference it makes.

Here are the shortcuts:

S Focus on Sessions tab header
T Focus on Statements tab header
D Focus on Details tab header
F Focus on Statistics tab header
Left / Right Move to the next / prev tab
Down / Up Move to next session / statement

Using those, you can use the common functionality of the profiler without touching the mouse.

time to read 2 min | 215 words

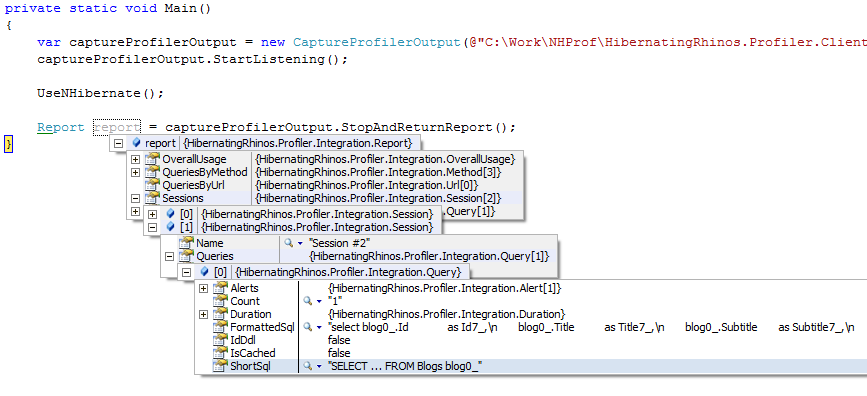
Well… I am still working done the list of stuff people request for the profiler (NH Prof, HProf, L2S Prof & EF Prof) , and one of the things that popped into the head of the list was wanting to have programmatic access to the profiler output. We aren’t talking about just the XML reports that are available, but to be able to get the data in a way that is easy to work with.

Well, here it is:

image

There is a new DLL in the profiler distribution, HibernatingRhinos.Profiler.Integration, where you can find the CaptureProfilerOutput class. That class will let you start the profiler, capture whatever happens in the middle, and finally stop and return you an instance of a report, containing all the data about what actually happened.

This is perfect if you want to use the profiler as part of your integration tests library. As an aside, you can also use the new DLL to programmatically parse (by using XML Serialization) the XML reports that you generate as part of your build, so you get very easy way to build rules around that report.

time to read 1 min | 146 words

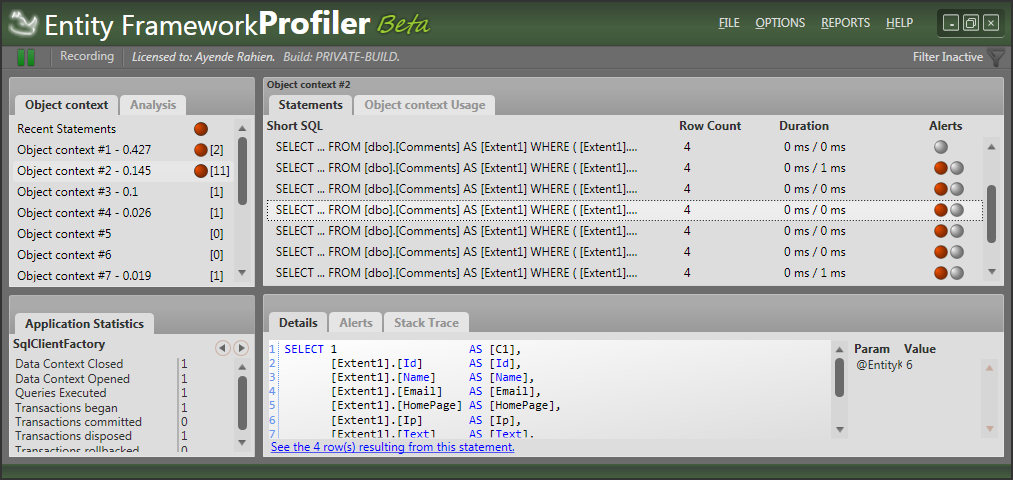
imageAfter some time in private beta, the Entity Framework Profiler has now to the public beta stage.

For the beta period, I am offering a 30% discount for EF Prof.

EF Prof brings the an unparallel level of insight into Entity Framework internals. You can see exactly what sort of actions Entity Framework takes against you database, view the results of queries, correlate queries to the matching lines of code that spawn them and get on the spot guidance when you are violating Entity Framework best practices.

Here is the screen shot, and you can also take a look at the live demo as well.

image

time to read 3 min | 538 words

One of the features that keep popping up for ÜberProf is that people want to use that in CI scenarios, usually to be able to programmatically check that they don’t have things like SELECT N+1 popping up, etc.

With build 562 of ÜberProf, this is now possible. How does this works? We now have a command line interface for ÜberProf, with the following options:

/CmdLineMode[+|-]         (short form /C)
/File:<string> (short form /F)
/ReportFormat:{Xml|Html} (short form /R)
/Port:<int> (short form /P)
/Shutdown[+|-] (short form /S)

Starting up with no options will result in the usual UI showing up, but you have a new mode available for you. Let us say that you want to output the results of your integration tests into a format that you can easily work with programmatically. Here is how it can be done:

nhprof.exe /CmdLineMode /File:Output.xml /ReportFormat:Xml <-- starts listening to applications
xunit.console.exe Northwind.IntegrationTests.dll
nhprof.exe /Shutdown <-- stop listening to applications and output the report

The example is using NH Prof, but the same holds for all the other variants.

The way it works is very simple and should be pretty easy to integrate into your CI process. The XML output can give you programmatic access to the report, while the HTML version is human readable.

One thing that you might want to be aware of, writing the report file is done in an async manner, so the shutdown command may return before writing the file is done. If you need to process the file as part of your build process, you need to wait until the first profiler instance is completed. Using PowerShell, this is done like this:

nhprof.exe /CmdLineMode /File:Output.xml /ReportFormat:Xml
xunit.console.exe Northwind.IntegrationTests.dll
nhprof.exe /Shutdown
get-Process nhprof | where {$_.WaitForExit() } <-- wait until the report export is completed

Please note that from a licensing perspective, the CI mode is the same as the normal GUI mode. On one hand, it means that you don’t need to do anything if you have the profiler already. On the other, if you want to run it on a CI machine, you would need an additional license for that.

FUTURE POSTS

  1. RavenDB & Distributed Debugging - 3 days from now
  2. RavenDB & Ansible - 6 days from now

There are posts all the way to Jul 21, 2025

RECENT SERIES

  1. RavenDB 7.1 (7):
    11 Jul 2025 - The Gen AI release
  2. Production postmorterm (2):
    11 Jun 2025 - The rookie server's untimely promotion
  3. Webinar (7):
    05 Jun 2025 - Think inside the database
  4. Recording (16):
    29 May 2025 - RavenDB's Upcoming Optimizations Deep Dive
  5. RavenDB News (2):
    02 May 2025 - May 2025
View all series

Syndication

Main feed ... ...
Comments feed   ... ...
}